How HumanTrak’s normative data reports can help drive better decision-making
Purpose
HumanTrak users want to benchmark their patients’ HumanTrak report data against what is considered normal. Because HumanTrak users collect data from patients young and old, and across different sexes, it is important that the normative value is specific to each patient’s age and sex.
Due to the incredible value that normative data can provide to your clients, our data science team have generated this HumanTrak normative data report. The report summarizes anonymized results from popular HumanTrak tests completed by over 16,000 individuals from clinics throughout the world. The motivation behind showing this data is to help you better understand and interpret your client’s data after they perform HumanTrak tests. For example, if you are rehabilitating a client with a shoulder injury, you may conduct shoulder assessment tests and compare your client’s range of motion against the normative data to help understand how far your client’s shoulder range of motion is from normal. This information may enable you to make more informed decisions about their treatment journey.
Currently, this report includes joint angles and other relevant movement metrics recorded during the following popular tests:
Test | Description |
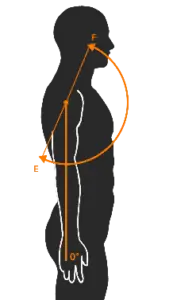
Shoulder Flexion / Extension
| Shoulder Flexion/Extension is calculated by taking the angle created by the humerus (upper arm) relative to the line of the trunk in the sagittal plane (side view). Typical uses for this test include comparisons of range of motion between left and right sides and identifying movement compensations. |
Shoulder Abduction / Adduction
| Shoulder Adduction/Abduction is calculated by taking the angle created by the humerus (upper arm) relative to the line of the trunk in the frontal plane (front view). Typical uses for this test include comparisons of range of motion between left and right sides, and identify movement compensations as individuals try to lean over to ‘cheat’ the test. |
Single Leg Squat
| Single Leg Squat is a dynamic movement assessment that provides insight into an individual’s balance, stability, flexibility, and strength. Common metrics of interest include dynamic knee valgus, peak hip and knee flexion, and movement of the knee anteriorly. Comparison of results between left and right sides is also important to help identify muscular strength deficiencies. |
Squat
| Squat is a dynamic movement assessment that provides insight into an individual’s balance, stability, flexibility, and strength. Common metrics of interest include dynamic knee valgus, peak hip and knee flexion, and movement of the knees anteriorly. |
Overhead Squat
| Overhead Squat is a dynamic movement that provides insight into an individual’s balance, stability, flexibility, and strength. Common metrics of interest include dynamic knee valgus, peak hip and knee flexion, and movement of the knees anteriorly. |
Cervical Lateral Flexion
| Cervical Spine Lateral Flexion (left and right) is calculated by taking the inclination of the head relative to the line of the trunk in the frontal plane (front view). Comparing peak left and right lateral flexion can help identify movement deficiencies and track progress over time during rehabilitation. |
Cervical Flexion/Extension
| Cervical Spine Flexion (forward) and Extension (backwards) is calculated by taking the inclination of the head relative to the line of the trunk in the sagittal plane (side view). Comparing peak flexion and extension against norms can help identify movement deficiencies and track progress over time during rehabilitation. |


To access data of individual HumanTrak tests, click on the individual test names in the left-hand menu:
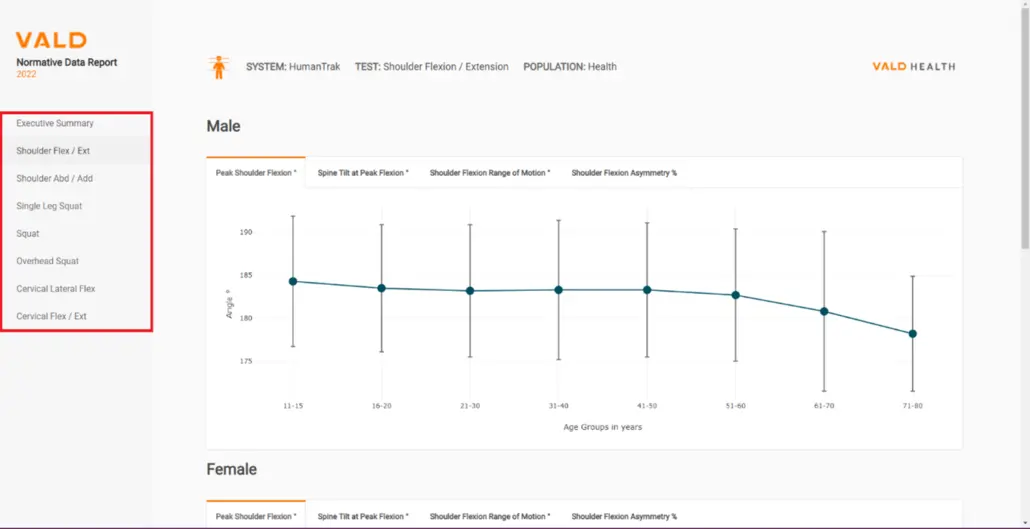
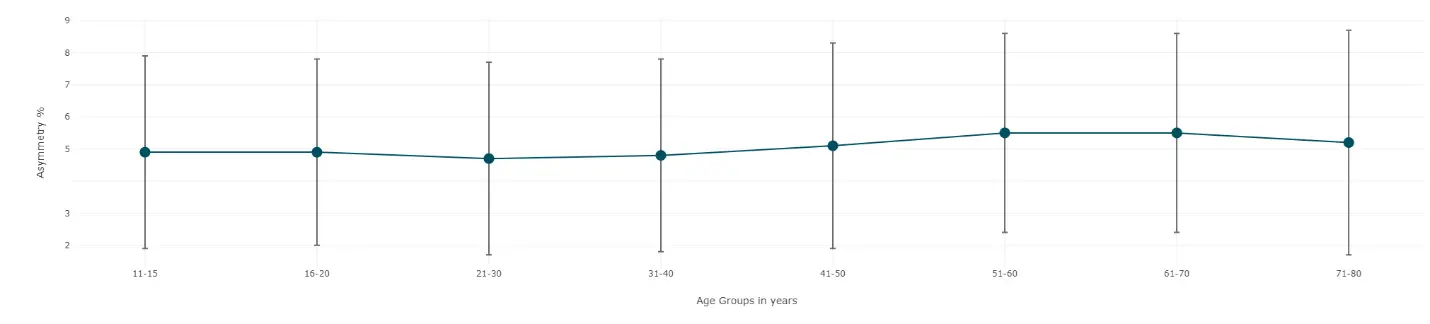
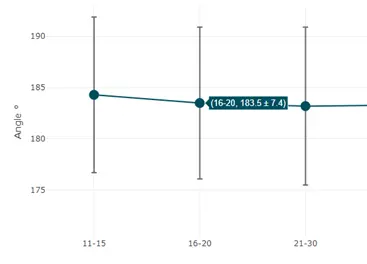
After clicking on a test type, you will be displayed with male and female charts for the relevant metrics reported by the HumanTrak system. For each of these metrics, you will be able to view normative data of males and females across different age groups. The y-axis values correspond to the average joint angles with error bars denoting the population variation, and the x-axis separates the values by different age groups.
Cycle through the metrics by clicking on the names in the top panel:
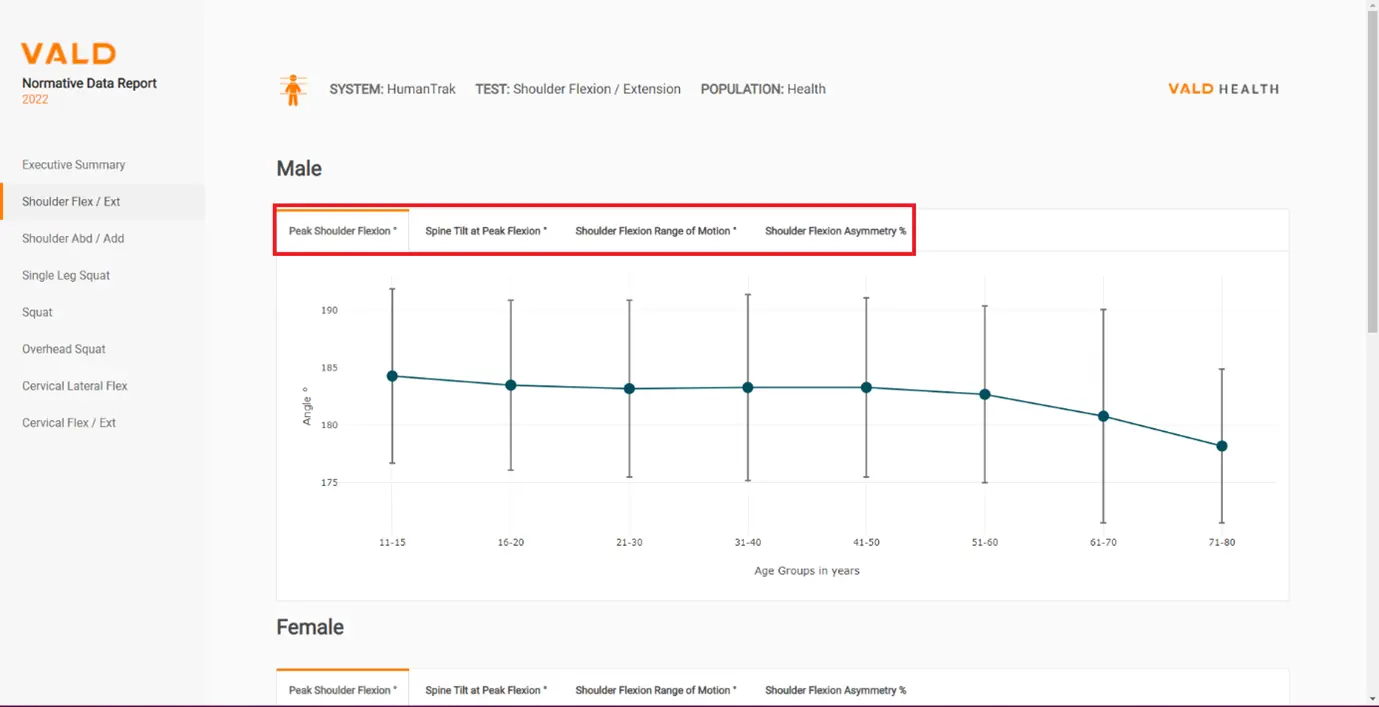
If you click on the shoulder flexion/extension test, you will see the following metrics:
Peak shoulder flexion
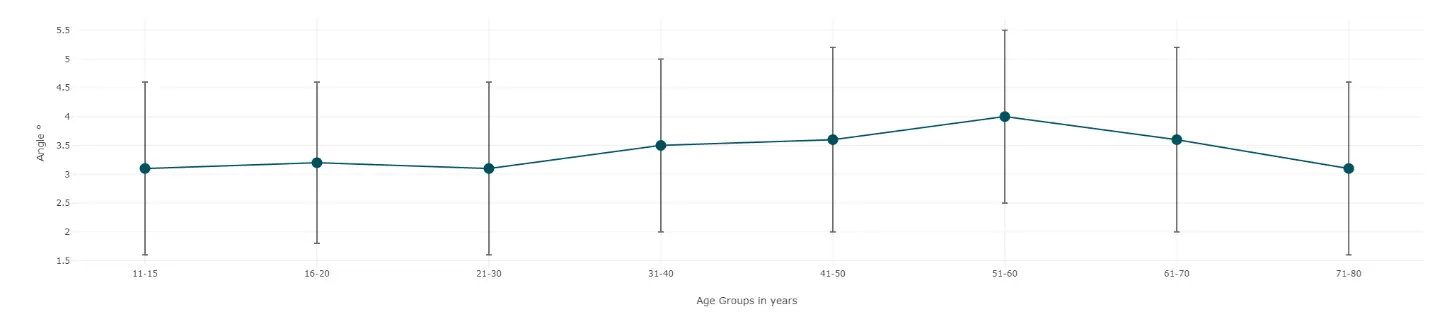
Spine tilt at peak flexion
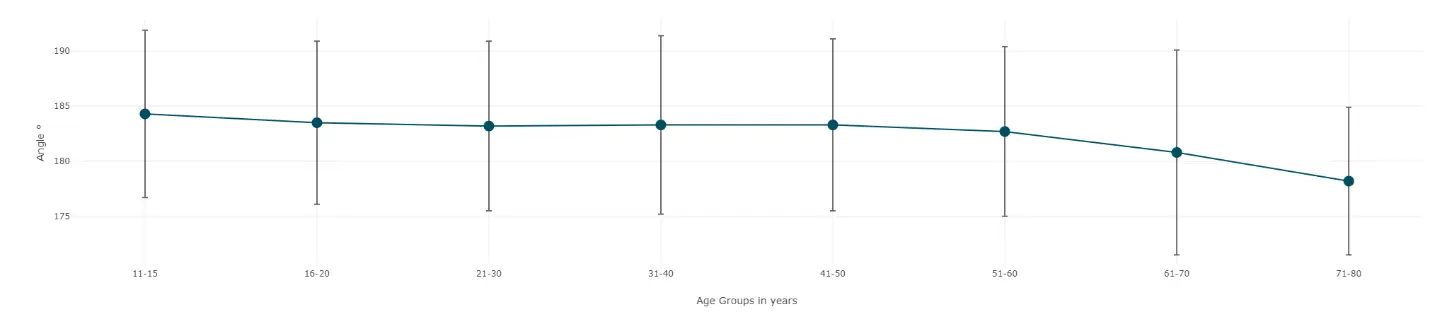
Shoulder flexion range of motion
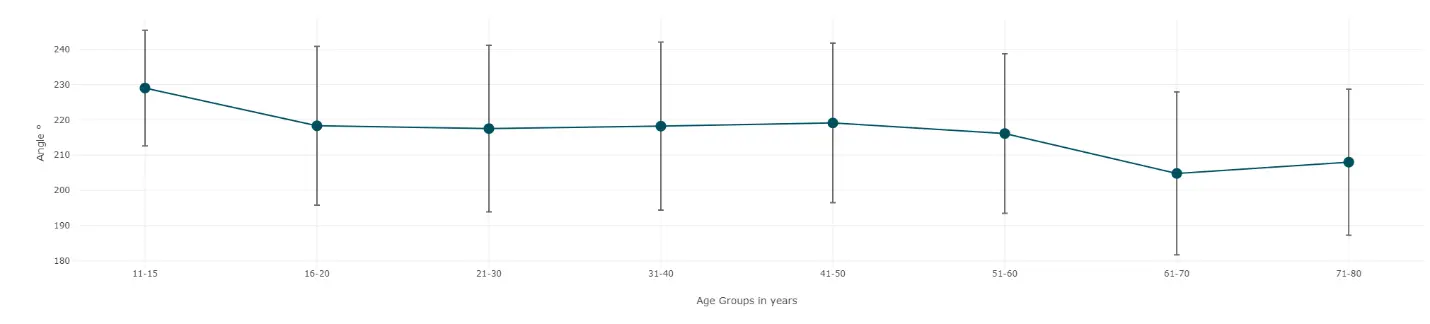
Shoulder flexion asymmetry (differences between left and right side)
Interactive charts
By hovering over data points in the charts, you will also be able to able to view the average and standard deviation of the age group:
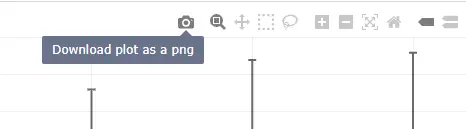
Additional chart functionality is available in the top right corner of each chart. For example, you can quickly export an image of the chart if you want to print it and place it somewhere in your clinic for quick reference.
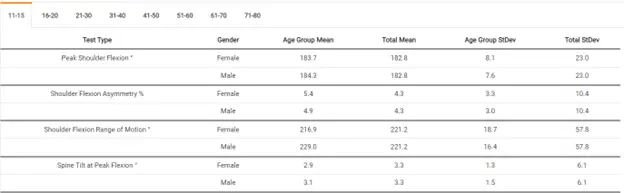
In addition to the interactive charts, we also provide summary tables for all relevant metrics across different age groups to obtain easy access to these data.
If you would like to see any additional metrics and/or tests included in these reports, please contact us at support@valdperformance.com.