Squat Assessment: Understanding kinetics and kinematics
Available in:
EN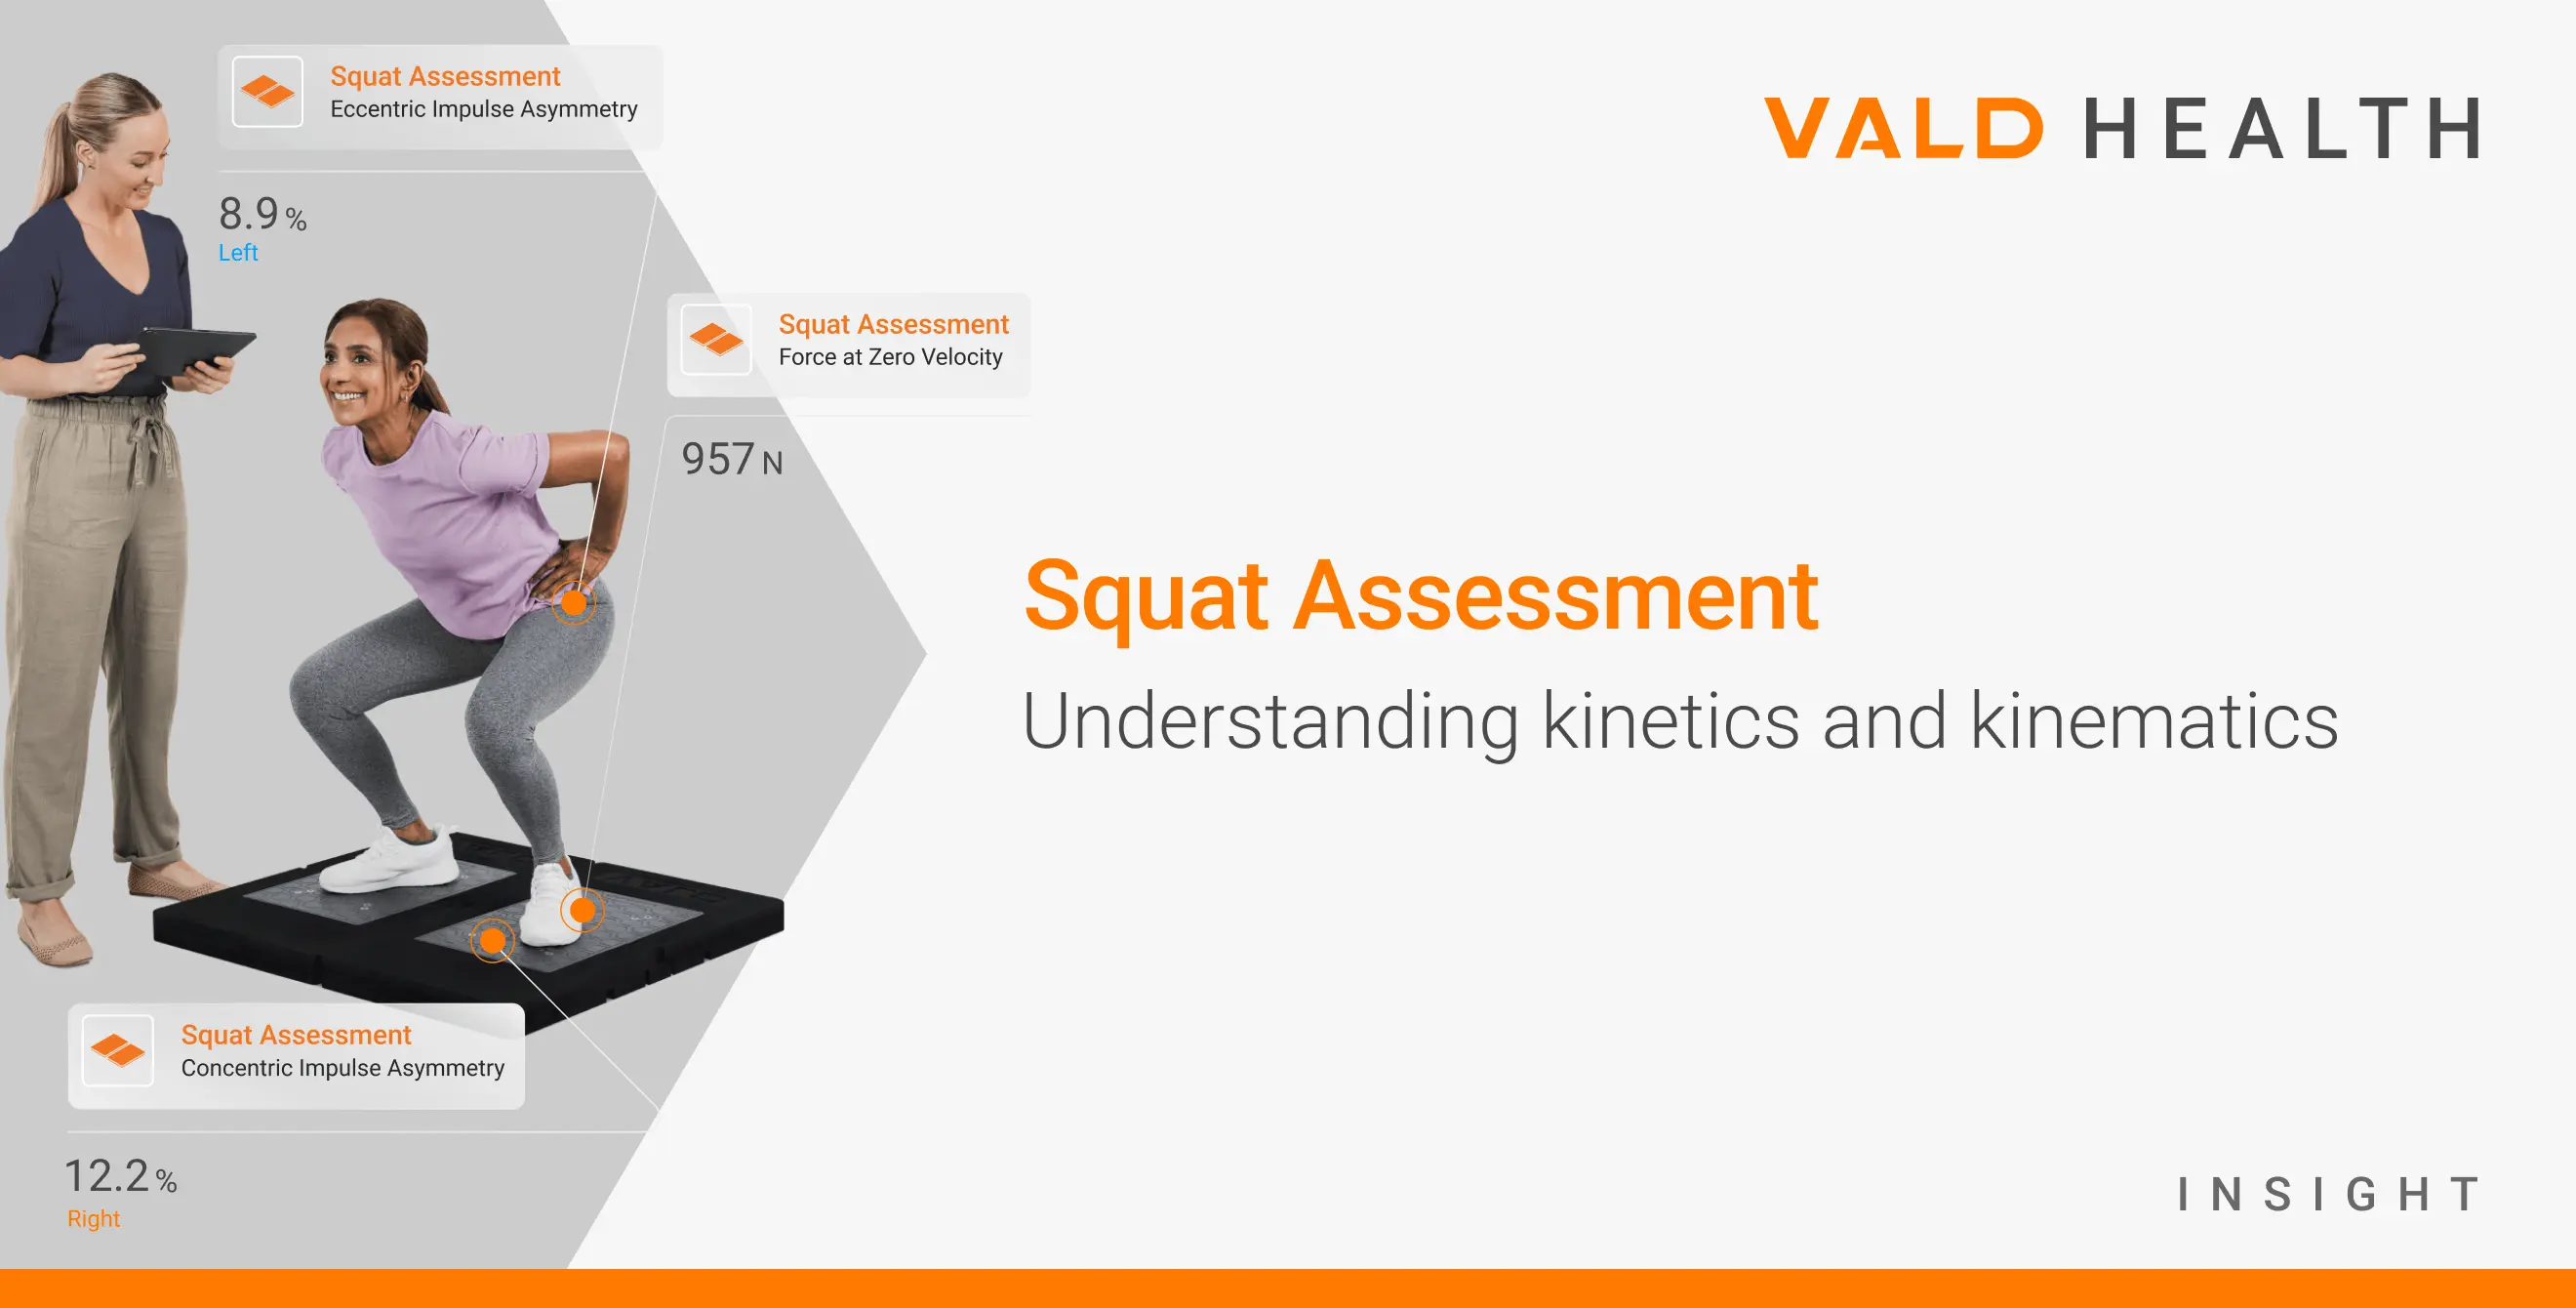
The squat assessment is an insightful, scalable tool for assessing athletic performance and injury risk. When assessed with technology, it offers detailed metrics and insights into a patient’s capabilities and limitations.
Below is a guide on squat assessment considerations, techniques and relevant insights using technology-enabled assessment methods with systems such as ForceDecks and HumanTrak.
What Is the Squat Assessment and Why Is It Important?
The squat is a fundamental human movement pattern involving coordinated multi-joint flexion and extension of the lower extremities. The squat and its variations (e.g., sit-to-stand) are performed by many in their daily lives, making it a simple, approachable and functional assessment for the vast majority of patients.
Its strength lies in its scalability – allowing practitioners to assess function and performance across a full spectrum, from basic sit-to-stands to 1-repetition-maximum (1RM) squats.
Its strength lies in its scalability – allowing practitioners to assess function and performance across a full spectrum, from basic sit-to-stands to 1RM squats.
The range of STS and squat assessments.
As one of the most widely assessed and trained exercises across the human performance continuum, squat assessments provide critical insights into:
- Lower-limb strength and power output
- Movement quality and efficiency
- Neuromuscular control and coordination
- Functional capacity across athletic and general populations
- Bilateral asymmetries and movement strategy changes
This versatile assessment can be applied across multiple contexts – from identifying and preventing fall risks in geriatric populations to optimizing athletic performance in elite sports (Montero-Odasso et al., 2021). With technologies such as ForceDecks and HumanTrak, practitioners can now individually capture both kinetic (force-specific) and kinematic (movement-specific) data to develop a comprehensive movement profile.
[Using]…ForceDecks and HumanTrak, practitioners can now individually capture both kinetic and kinematic data to develop a comprehensive movement profile.
Kinetics: Understanding Force Production
Kinetics refers to the forces that drive movement. During a squat on force plates, these forces are captured as force-time data, offering insight into the movement’s underlying mechanics. This allows practitioners to assess not just how much force is produced, but also when and how that force is applied throughout the movement.
Common ForceDecks metrics used by practitioners during the squat assessment.
Key Kinetic Metrics in a Squat Assessment
Force plates, such as ForceDecks, analyze squat patterns to offer valuable insights, serving both health- and performance-focused needs.
Metric selection is a specific process that is unique to the practitioner and their patients and should never be selected without context to the goals of rehabilitation and training. However, the following is a non-exhaustive list of common kinetic metrics that may be popular in various health and performance settings.
| Domain | Metric | Description |
|---|---|---|
| Health | Asymmetry (multiple phases) | Differences in force production between the right and left sides, expressed as a percentage difference in ForceDecks. Asymmetry values are available in different phases (e.g., eccentric and concentric) and at discrete time points (e.g., moment of zero velocity). |
| Eccentric impulse | Total force produced within the eccentric (downward) phase of the squat, providing an opportunity to assess the patient's braking capabilities. | |
| Performance | Rate of force development (RFD) | The speed at which force is produced within a given time interval (e.g., 0-100ms) or measured at a discrete time point (e.g., 75ms). |
| Force at zero velocity | The isometric force production capability at the transition point between eccentric and concentric phases, often considered a key determinant of overall strength capacity. | |
| Both | Mean force and peak force | The average and maximum force generated during different phases of the squat. Both metrics can be normalized to body weight (BW) to allow for accurate comparison between patients of different sizes. |
| Concentric impulse | The area under the force-time curve during the upward phase of the squat, representing the total force applied over time to accelerate the body and external load. |
The Squat Force-Time Curve
A typical force-time curve during a squat, provided by ForceDecks, reveals distinct phases and time points relevant for health and performance practitioners:
- Unloading Phase: As the patient initiates the descent, vertical ground reaction force decreases to allow the center of mass to accelerate downward.
- Eccentric Deceleration Phase: Ground reaction forces exceed BW as the patient controls the descent, reaching eccentric peak force at or near the bottom of the squat.
- Transition: The brief period at the bottom of the squat where movement direction changes from downward to upward.
- Concentric Phase: Force production to overcome momentum and accelerate the body or load upward.
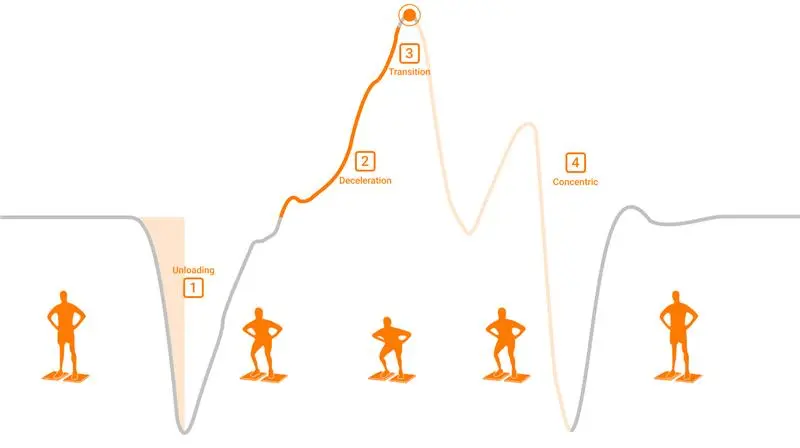
Typical force-time graph of a bodyweight squat assessment with key phases and time points labeled.
Although the shape, magnitude and timing of force-time characteristics are distinct in the squat assessment, considerable variations in execution and squat strategy occur from person to person. ForceDecks’ autodetect automatically identifies and analyzes squat force traces – accounting for individual variations – while operating seamlessly within a broader test battery (e.g., alongside jump assessments in the same recording window).
The resulting data provides a detailed profile of a patient’s neuromuscular function. For instance, reduced RFD may indicate changes in neural drive or muscle recruitment patterns (Aagaard, 2002).
…the shape, magnitude and timing of force-time characteristics…provides a detailed profile of a patient’s neuromuscular function.
While inter-limb asymmetries exceeding 10-15% have often been used as thresholds to assume increased injury risk (Paterno et al., 2007), recent research has highlighted the need for asymmetry thresholds to be taken into consideration with the specific metric in mind, rather than as a global figure across all metrics (Hart et al., 2019).
Clinical and Performance Applications of Kinetic Data
Understanding kinetic metrics provides multiple applications for practitioners. For rehabilitation professionals, these metrics can:
Differences in squat assessment key performance outcomes between health and performance practitioners.
Previous research has demonstrated that following lower extremity injury, patients often display altered force-time traces during squatting movements, including reduced mean and peak force, diminished RFD and increased asymmetry (Hart et al., 2019).
Differences in force-time analyses of a squat assessment between healthy and injured patients.
Kinetic performance deficits often persist long after symptoms resolve. Detailed squat assessment data from tools such as ForceDecks helps practitioners make more informed decisions…
Kinetic performance deficits often persist long after symptoms resolve. Detailed squat assessment data from tools such as ForceDecks helps practitioners make more informed decisions about progression and return-to-activity readiness.
Kinematics: Understanding Movement Quality
While kinetic data provides valuable insight into force production, kinematics – the resulting movement of a system influenced by those forces – can offer critical context for interpreting outcomes in complex clinical cases and advanced assessments.
Markerless motion-capture technology, such as HumanTrak, measures and analyzes movement by identifying joints, capturing segment motion and detecting changes in movement strategy such as asymmetry and compensatory strategies during dynamic tasks.
While force plates can quantify force-derived kinematic measures such as movement velocity and squat depth, technologies like HumanTrak provide detailed joint angle and symmetry analysis for a deeper evaluation of movement.
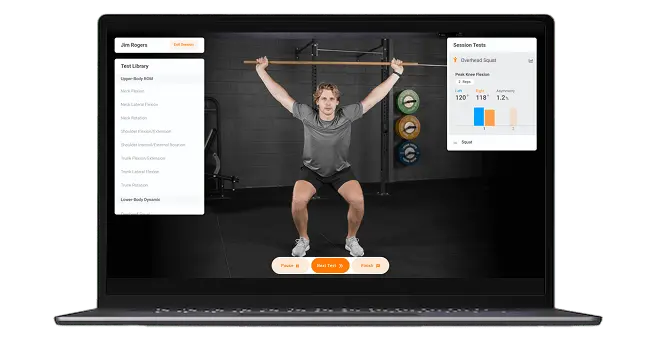
Kinematic analysis of overhead squat using HumanTrak.
Why Are Kinematics Important?
Both global and joint-specific kinematics during squatting provide essential context for interpreting force data. For example, two patients may produce identical peak forces, but achieve this through dramatically different movement strategies.
…two patients may produce identical peak forces, but achieve this through dramatically different movement strategies.
- Participant A may adopt a shallower squat strategy and inefficient joint positions (e.g., knee valgus) that may provide opportunities for improvement in injury and performance management (Slater & Hart, 2017).
- Participant B may produce similar total kinetics, but do so with a deeper squat strategy and adopt a varus or neutral joint positioning.
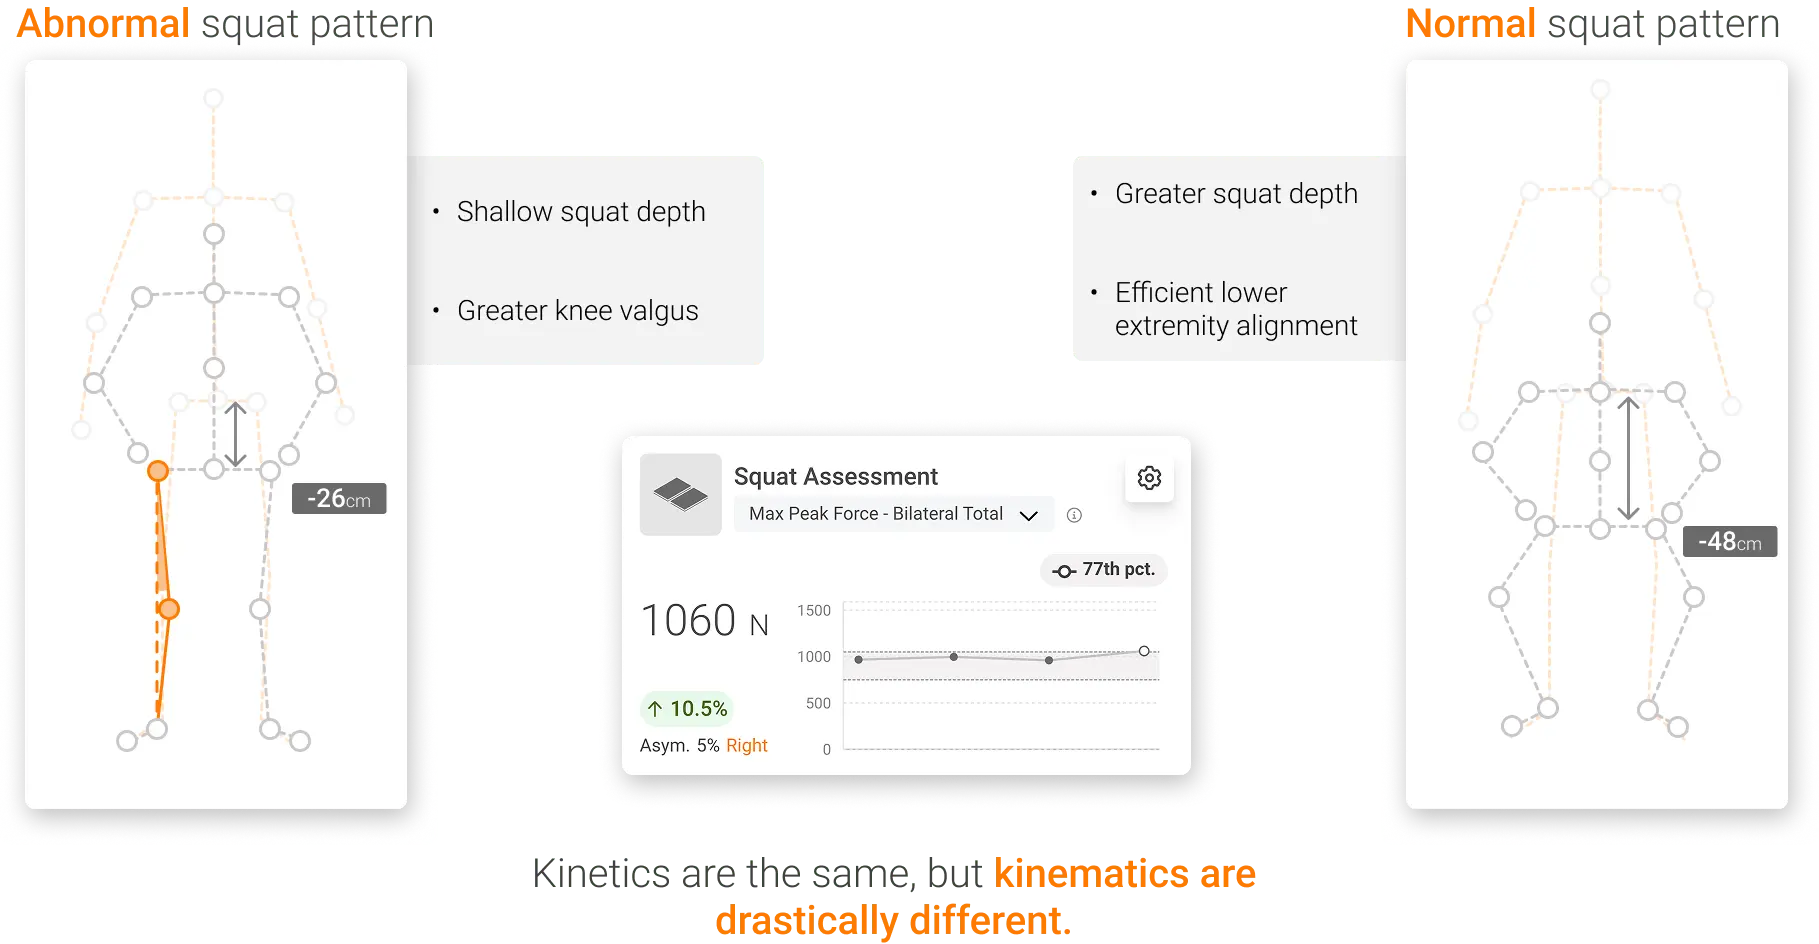
Comparison of squat strategy characteristics when kinetics are the same.
These conditions, while the kinetics are identical, may have vastly different intervention strategies to best optimize the patient’s specific squat execution. In these examples, kinematic analysis allows practitioners to do the following:
- Identify movement compensations and limitations
- Assess range of motion constraints at specific joints
- Evaluate movement coordination and sequencing
- Detect changes in movement strategy under different conditions (e.g., fatigue and load)
Injury and performance result from complex interactions that cannot be reduced to a single joint position, force output or alignment issue. Therefore, by assessing both kinetic and kinematic data, practitioners can identify multiple contributing factors and deliver more targeted, effective interventions.
Injury and performance result from complex interactions…assessing both kinetic and kinematic data [helps] identify contributing factors and deliver more targeted, effective interventions.
Comparison of common foci in kinetic and kinematic assessments.
Key Kinematic Metrics in a Squat Assessment
Like kinetic testing, a single squat assessment can produce a wide range of kinematic metrics. The choice of which to use often depends on the practitioner’s expertise and the patient’s goals. Still, a few core metrics are commonly used in both health and performance settings.
| Common Application | Metric | Description |
Capable Systems |
|---|---|---|---|
| Performance |
Squat depth | The maximum negative displacement of the patient’s center of mass. | ForceDecks |
|
Mean concentric velocity | Average upward speed from maximum squat depth to end of movement. | ForceDecks | |
| Health |
Hip flexion angle at peak knee flexion* | Maximum sagittal plane range of motion achieved in each hip, commonly reaching 105-120° in full-depth squats. | HumanTrak |
|
Peak knee flexion* | Maximum sagittal plane range of motion achieved in each knee, commonly reaching 110-130° in full-depth squats. | HumanTrak | |
| Health and Performance |
Hip adduction at peak knee flexion* | Maximum frontal plane range of motion achieved in each hip; results will vary based on the patient’s strengths and weaknesses. | HumanTrak |
*Indicates values that have options for limb symmetry comparisons.
Research by Ford et al. (2015) shows that those with greater dynamic knee valgus during squatting are at higher risk for non-contact ACL injuries. Similarly, Rabin et al. (2016) found that limited ankle dorsiflexion often leads to increased forward trunk lean and potential lumbar spine overload. Understanding these kinematic patterns helps practitioners apply movement data more effectively to guide rehabilitation and performance outcomes.
Understanding…kinematic patterns helps practitioners apply movement data more effectively…
Best Practices for Squat Assessment
When performing squat assessments, several considerations will ensure reliable and meaningful data:
A patient performing a squat assessment on ForceDecks.
To ensure reliable and meaningful squat assessments, practitioners should begin by standardizing testing protocols. This includes providing clear instructions, using consistent foot positioning and applying standardized cues for squat depth and movement speed. Tests should be performed under similar conditions each time – whether the patient is fresh or fatigued – to enhance the reliability of serial measurements.
Selecting the appropriate test is also essential. Assessments should match the patient’s capacity and goals – for example, sit-to-stand or bodyweight squats for beginners or those in early rehabilitation are likely more suitable than a 1RM squat assessment.
For athletic populations, incorporating different movement velocities can reveal unique aspects of neuromuscular function and kinetic output. Similarly, testing under both unloaded and loaded conditions, when appropriate, can highlight how movement patterns adapt under stress.
Finally, regular reassessment enables practitioners to track progress and identify meaningful changes over time in response to training or rehabilitation interventions.
Sport-specific, population-specific or task-specific modifications may be appropriate depending on the patient’s goals and requirements.
A Holistic Assessment Approach
The squat assessment offers valuable insights into movement capacity, neuromuscular function and potential injury risk.
Kinetic and kinematic analyses enable practitioners to gain a clearer understanding of a patient’s force and movement profile. This integrated approach supports truly individualized program design – whether for rehabilitation or performance.
To learn more about integrating ForceDecks and HumanTrak into your squat assessment protocols, feel free to contact us.
References
- Montero-Odasso, M., van der Velde, N., Alexander, N. B., Becker, C., Blain, H., Camicioli, R., Close, J., Duan, L., Duque, G., Ganz, D. A., Gómez, F., Hausdorff, J. M., Hogan, D. B., Jauregui, J. R., Kenny, R. A., Lipsitz, L. A., Logan, P. A., Lord, S. R., Mallet, L., & Marsh, D. R. (2021). New horizons in falls prevention and management for older adults: A global initiative. Age and Ageing, 50(5), 1499–1507. https://doi.org/10.1093/ageing/afab076
- Aagaard, P., Simonsen, E. B., Andersen, J. L., Magnusson, P., & Dyhre-Poulsen, P. (2002). Increased rate of force development and neural drive of human skeletal muscle following resistance training. Journal of Applied Physiology, 93(4), 1318–1326. https://doi.org/10.1152/japplphysiol.00283.2002
- Paterno, M. V., Ford, K. R., Myer, G. D., Heyl, R., & Hewett, T. E. (2007). Limb asymmetries in landing and jumping 2 years following anterior cruciate ligament reconstruction. Clinical Journal of Sport Medicine, 17(4), 258–262. https://doi.org/10.1097/jsm.0b013e31804c77ea
- Hart, L. M., Cohen, D. D., Patterson, S. D., Springham, M., Reynolds, J., & Read, P. (2019). Previous injury is associated with heightened countermovement jump force‐time asymmetries in professional soccer players. Translational Sports Medicine, 2(5), 256–262. https://doi.org/10.1002/tsm2.92
- Slater, L. V., & Hart, J. M. (2017). The influence of knee alignment on lower extremity kinetics during squats. Journal of Electromyography and Kinesiology, 34, 69–75. https://doi.org/10.1016/j.jelekin.2016.10.004
- Ford, K. R., Nguyen, A. D., Dischiavi, S. L., Hegedus, E. J., Zuk, E. F., & Taylor, J. B. (2015). An evidence-based review of hip-focused neuromuscular exercise interventions to address dynamic lower extremity valgus. Open Access Journal of Sports Medicine, 6, 291–303. https://doi.org/10.2147/OAJSM.S72432
- Rabin, A., Kozol, Z., Spitzer, E., & Finestone, A. S. (2016). Weight-bearing ankle dorsiflexion range of motion—can side-to-side symmetry be assumed? Journal of Athletic Training, 51(3), 233–240. https://doi.org/10.4085/1062-6050-49.3.40