Balance testing with ForceDecks: A beginner’s guide to Centre of Pressure metrics
Available in:
EN
How much do you know about Centre of Pressure metrics with ForceDecks?
- ForceDecks Dual Force Plate System by VALD automatically calculates Centre of Pressure (CoP) metrics when a balance assessment is performed.
- Lower values for total excursion, mean velocity and area of CoP ellipse are typically associated with an individual having good postural control.
- Multiple factors should be considered when making clinical judgements as there is not a consensus among force plate researchers on the correct interpretation of many CoP metrics.
Balance testing
ForceDecks includes three balance tests that enable users to measure an individual’s Centre of Pressure (CoP).For newcomers to balance testing, using force plate metrics can be difficult to understand. In this article, we cover three balance metrics that are derived from CoP and common ways of interpreting them.
ForceDecks balance tests
ForceDecks measures CoP during the below assessments:
- Quiet Stand (QSB)
- Single Leg Stand (SLSB)
- Single Leg Range of Stability (SLROSB)
Balance test parameters
Once the balance test is selected, you can set the following test parameters to increase assessment difficultly:
- Eyes open / closed
- Stable / unstable surface
- Secondary task
- Test length (seconds)
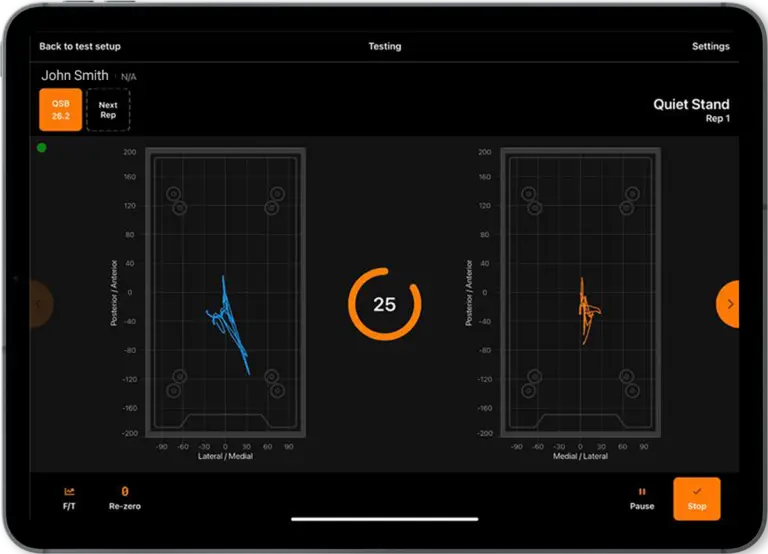
During the test recording, a trace of the CoP for the left and /or right leg are displayed instantly onscreen. Once the test is completed, ForceDecks will auto-analyse the results.
Centre of Pressure (CoP) metrics
Centre of Pressure (CoP) is a powerful tool for measuring and understanding performance during balance exercises.Read on to learn about the CoP metrics that ForceDecks Dual Force Plate System calculate.
CoP Metric 1: Total Excursion [mm]
Definition
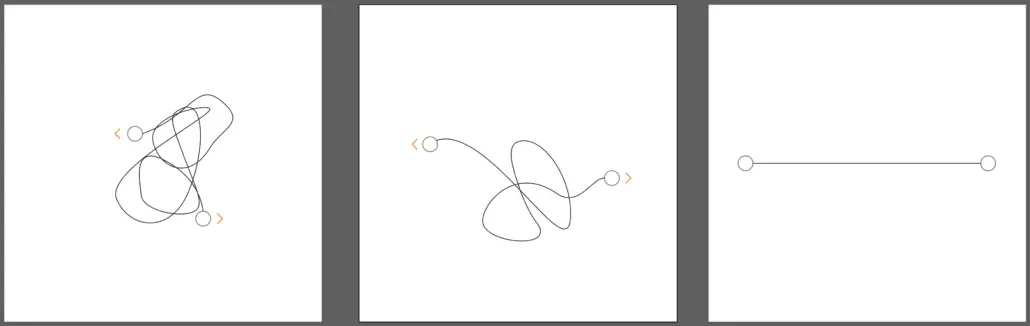
Total excursion is the distance that the CoP travels throughout the assessment, or the length of the CoP trace (Figure 2). It is one of the simplest metrics that can be derived from a CoP trace.Total excursion naturally changes with the length of the assessment (e.g., total excursion for a 30 second balance test will be about double the total excursion for a 15 second balance test), so total excursion values should only be compared between assessments of the same length.
Interpretation
As a general rule, a lower value for total excursion indicates that an individual excels at postural control, while a higher value for total excursion is interpreted as a sign that the individual has difficultly balancing, often caused by poor proprioception or muscle control [1, 2, 4].For instance, individuals with lower back pain have increased total excursion as compared to healthy individuals, likely due to a deterioration of proprioception through the spine or difficultly in generating rapid muscle activation due to pain [2].
CoP Metric 2: Mean Velocity [mm/s]
Definition
Mean velocity is the average speed that the CoP travels at throughout the assessment. It is calculated by dividing the total excursion by the length of the test.While more complex to calculate, mean velocity is preferable to total excursion because it is comparable between assessments of different lengths.
Interpretation
A low value for mean velocity is commonly interpreted as meaning that the individual has good control over their posture, while a high value for mean velocity indicates that an individual is struggling to maintain their balance.In a study of athletes and non-athletes, the athletes’ mean velocity during balance assessments was lower than the non-athletes [4]. This difference became more pronounced as the balance assessments were made more difficult (e.g., eyes closed or unstable surface).However, other factors should be used in making a clinical judgement as this general interpretation is not concrete.It is possible that in some cases an individual with good postural control’s mean velocity may be higher because they respond to perturbations to their balance quickly, or an individual with poor postural control’s mean velocity may be lower because they do not sense the need to correct their balance at all.
CoP Metric 3: Area of CoP Ellipse [mm2]
Definition
The CoP ellipse is the smallest possible ellipse (i.e., oval) that includes 95% of the CoP data points (Figure 3). Area is a measurement of the size of the ellipse, with a larger area corresponding to a larger ellipse.
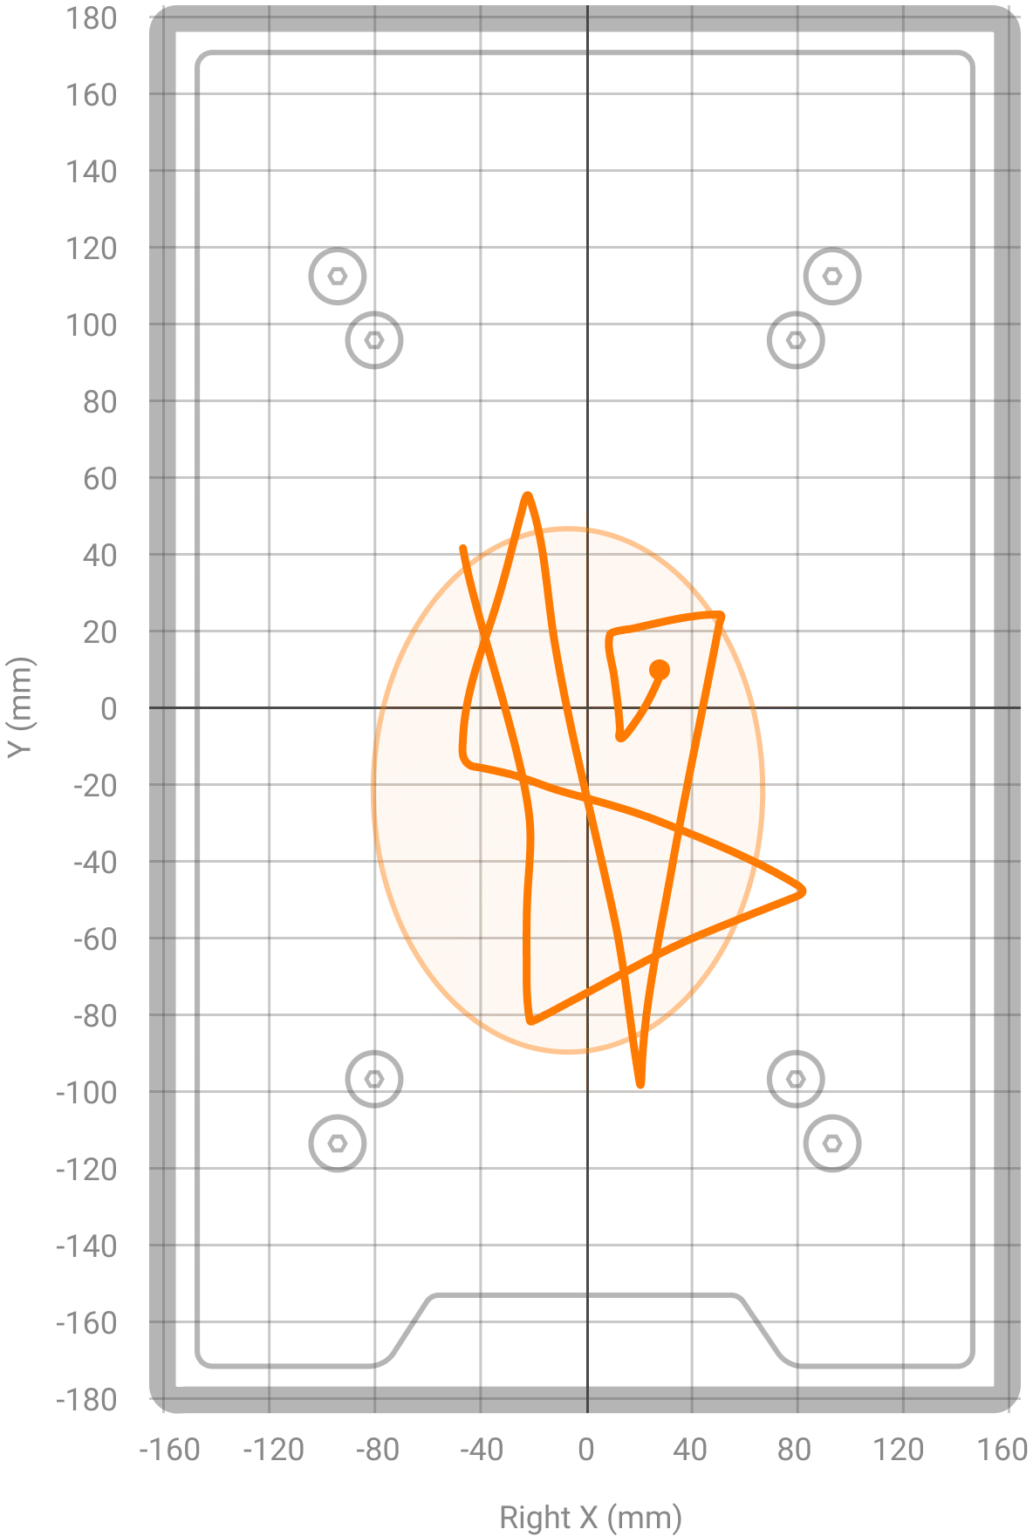
Figure 2. The CoP trace during a Single Leg Stand test. The CoP ellipse is shown as the orange oval surrounding the CoP trace.
Interpretation
Area of CoP ellipse (AoE) is an indication of the space an individual’s CoP requires for them to remain upright. It is commonly used in clinical studies [3], but has less of a consensus as to its correct interpretation during standard balance assessments where the goal is to move as little as possible (e.g., Quiet Stand and Single Leg Stand).
Broadly, a lower value for AoE is interpreted as positive, as the individual is able to tightly control their CoP.However, AoE is simpler to interpret during a Single Leg Range of Stability assessment.In this exercise the individual is trying to move their CoP as far as possible in each direction, which will also create a larger ellipse.
An asymmetry in AoE during a Single Leg Range of Stability assessment indicates a weakness in balance on the side with the lower value.
Download ‘Balance testing with ForceDecks’ pdf document here.
Want to learn more about Centre of Pressure measurement with ForceDecks?
Visit our support page to learn more.
Chat to our team about how ForceDecks can benefit your practice
Our friendly team of scientists and subject matter experts at VALD are well-equipped to answer your questions. Learn more about the VALD Client Success team and book a call at the link below.
Prefer to get in touch via email? Email us at info@valdhealth.com or click the button below.
References
- Palmieri, R. M., Ingersoll, C. D., Stone, M. B., & Krause, B. A. (2002). Center-of-pressure parameters used in the assessment of postural control. Journal of Sport Rehabilitation, 11(1), 51–66. https://doi.org/10.1123/jsr.11.1.51
- Ruhe, A., Fejer, R., & Walker, B. (2011). Center of pressure excursion as a measure of balance performance in patients with non-specific low back pain compared to healthy controls: A systematic review of the literature. European Spine Journal, 20(3), 358–368. https://doi.org/10.1007/s00586-010-1543-2
- Swanenburg, J., de Bruin, E. D., Uebelhart, D., & Mulder, T. (2010). Falls prediction in elderly people: A 1-year prospective study. Gait and Posture, 31(3), 317–321. https://doi.org/10.1016/j.gaitpost.2009.11.013
- Thompson, L., Badache, M., Cale, S., Behera, L., & Zhang, N. (2017). Balance Performance as Observed by Center-of-Pressure Parameter Characteristics in Male Soccer Athletes and Non-Athletes. Sports, 5(4), 86. https://doi.org/10.3390/sports5040086