Different Sites Have Different Demands
Available in:
EN
About the Author
Fearghal Kerin, BSc, MSc, PhD, is a chartered physiotherapist with extensive experience in elite sport. He is the co-founder and clinical director of Kerin Performance.
He spent nine seasons as a rehabilitation physiotherapist at Leinster Rugby before joining Chelsea Football Club in the English Premier League, where he worked with international athletes, including Premier League, Champions League and World Cup winners.
This case study was featured in the Practitioner’s Guide to Hamstrings and explores how injury sublocation influences movement strategy, testing interpretation and return-to-play outcomes following hamstring strain injuries.

Not all hamstring injuries are created equal. One of the most significant shifts in modern hamstring management is understanding how injury sublocation influences recovery. There are three main considerations for athlete prognosis and rehabilitation demands:
- Injury Site: Muscle belly, musculotendinous junction or intramuscular tendon
- Injury Position: Proximal, distal or central
- Injured Muscle: Biceps femoris (long or short head), semitendinosus and semimembranosus
Rehabilitation expectations and benchmarks used to track progress should adapt to the specific injury at hand.
Rehabilitation expectations and benchmarks used to track progress should adapt to the specific injury at hand. Strength in one test or metric does not guarantee strength across others, highlighting the need for a broad, flexible approach to identifying key performance indicators.
The T-Junction Trap
Distal hamstring T-junction injuries present a consistent and unique clinical challenge, marked by high recurrence rates (Kerin, 2025).
In testing, athletes with T-junction involvement often display strong Nordic hamstring exercise (NHE) scores on NordBord, likely reflecting dominance of the distal hamstrings, which contribute heavily to the test. However, when athletes are assessed in positions with a straighter knee, such as prone isometrics on NordBord or knee flexion testing on ForceFrame, clear deficits typically emerge.
Clinically, an athlete may appear symmetrical on dynamic tests like the NHE, yet show 15-20% asymmetry during long-lever isometric knee flexion assessments.
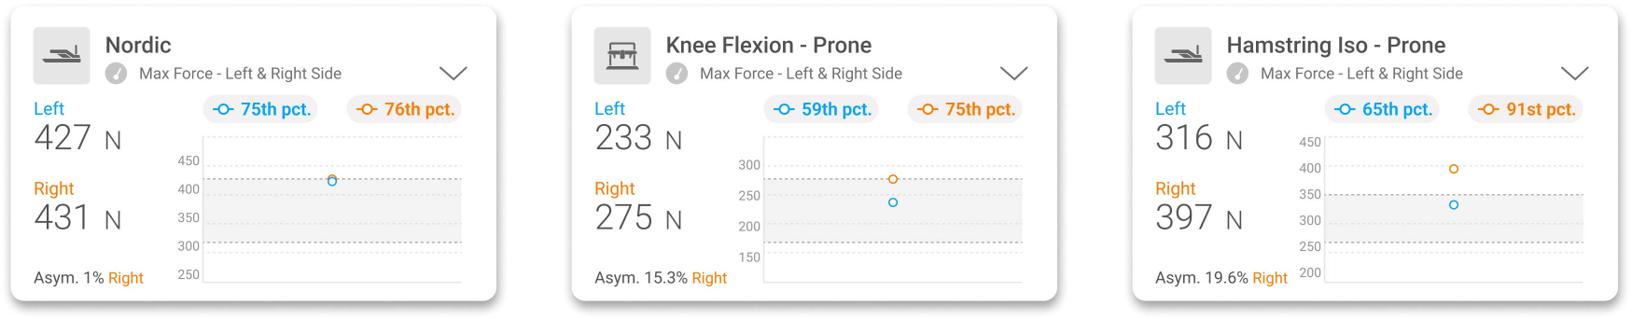
Example of an athlete appearing symmetrical on the NHE but showing a 15-20% asymmetry on prone isometric tests.
If return-to-sport clearance were based on NHE performance alone, the athlete’s performance would appear “ready.” However, testing across multiple test angles provides a clearer picture, reducing the risk of missing key weaknesses and ultimately supporting higher-quality rehabilitation.
Graft Site Hangover
A different yet equally common presentation, particularly with medial hamstring injuries, involves pronounced performance and asymmetry deficits in the NHE. This pattern often stems from residual weakness after the harvesting of a semitendinosus graft for anterior cruciate ligament (ACL) reconstruction. If not addressed early, these deficits can become difficult to reverse, leaving athletes underprepared for the demands of return to play.
A different yet equally common presentation, particularly with medial hamstring injuries, involves pronounced performance and asymmetry deficits in the NHE.
In other cases of surgical repair (e.g., following semitendinosus tenotomy or tenodesis), reducing asymmetry on NordBord can be extremely difficult. Understanding muscle function and injury history is key to interpreting test results and setting appropriate rehabilitation targets.
Peak Force Is Incomplete
Athletes can appear symmetrical at peak performance characteristics (e.g., peak force or torque) but still lack strength through range. In the figure supplied, peak force is almost equal (6% side-to-side), but closer analysis reveals asymmetry throughout the remainder of the curve. This force-time trace highlights how the athlete struggles to build force through mid-range and hesitates early in the contraction.
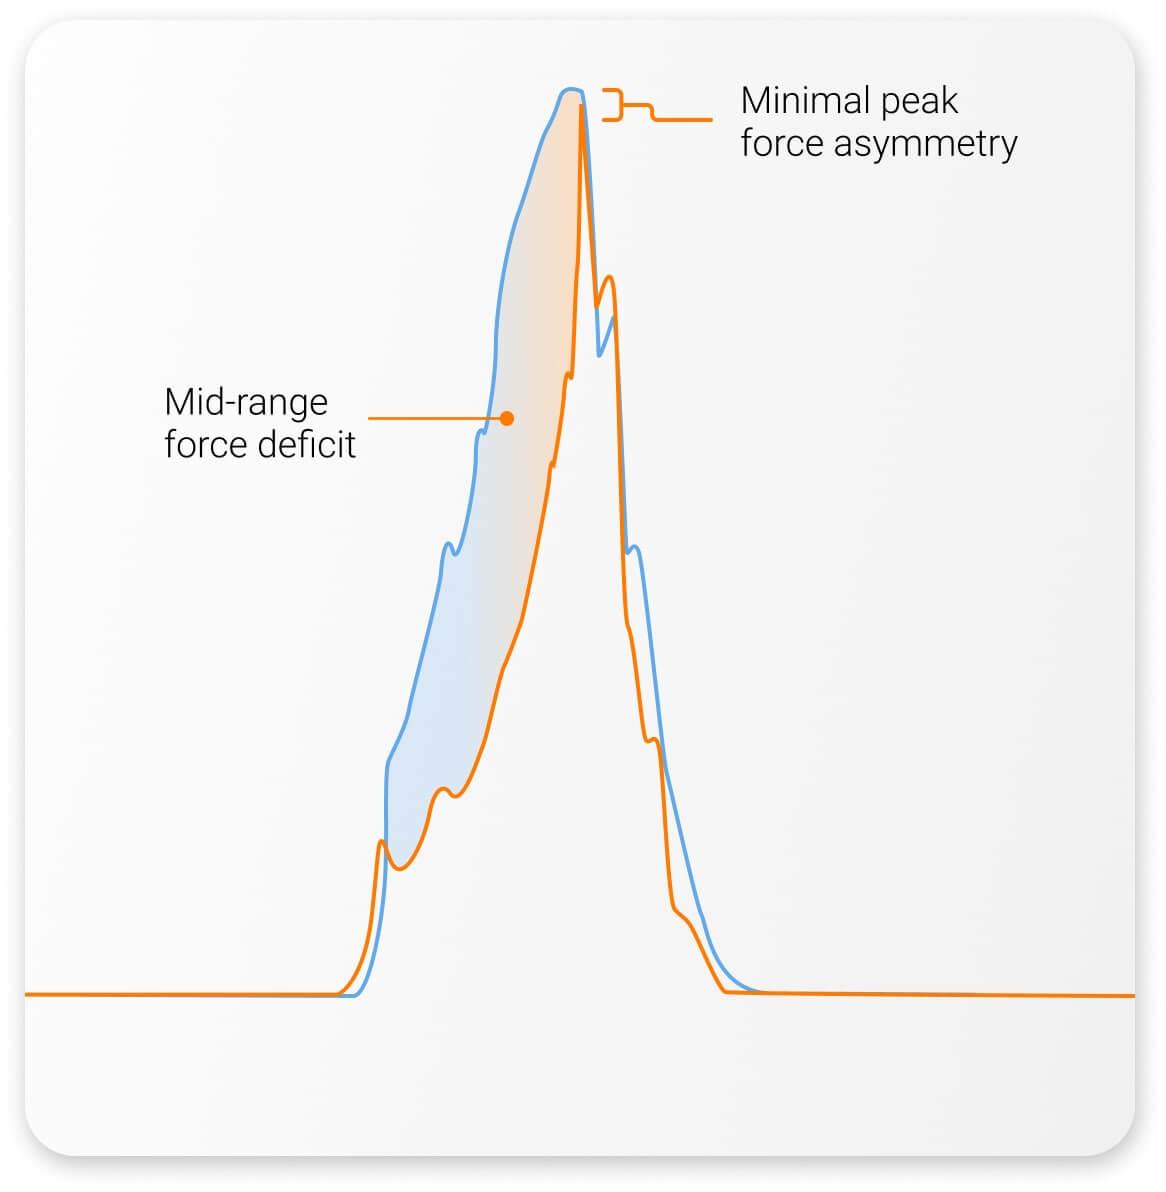
Athlete with near-symmetrical peak force, but a large mid-range deficit and poor early force build.
Identifying deficits like these can determine the success or failure of an athlete’s rehabilitation. While restoring maximal force production is essential, effective recovery extends beyond a single strength quality. By assessing the full force-time curve, practitioners can identify exactly where performance breaks down – and where intervention should focus.
By assessing the full force-time curve, practitioners can identify exactly where performance breaks down – and where intervention should focus.
Exercise Selection Is Everything
Once deficits have been identified, the next step is applying that information. Proper exercise selection accomplishes two goals:
- Targeting the weaknesses revealed by testing
- Ensuring strengths (whether within the hamstring or elsewhere) remain high-performing
These goals mean that exercise selection will vary from a loading, rate, range and volume perspective to ensure the athlete receives the right stimulus at the right time.
Testing results should guide stimulus application, as relying solely on standard progressions or preferred metrics risks overlooking injury-specific limitations.
Testing results should guide stimulus application, as relying solely on standard progressions or preferred metrics risks overlooking injury-specific limitations. For instance, an athlete may rank in the 89th to 95th percentile on a mid-range knee flexion and dynamic hamstring assessment, yet only average on the Iso-Prone. These results should prompt practitioners to consider the underlying mechanisms and specific functional roles each assessment serves within their overall testing process.
A practitioner prioritizing dynamic tests such as the NHE might dismiss the Iso-Prone result, but this underlying deficit could be the very factor hindering the athlete’s rehabilitation progress.
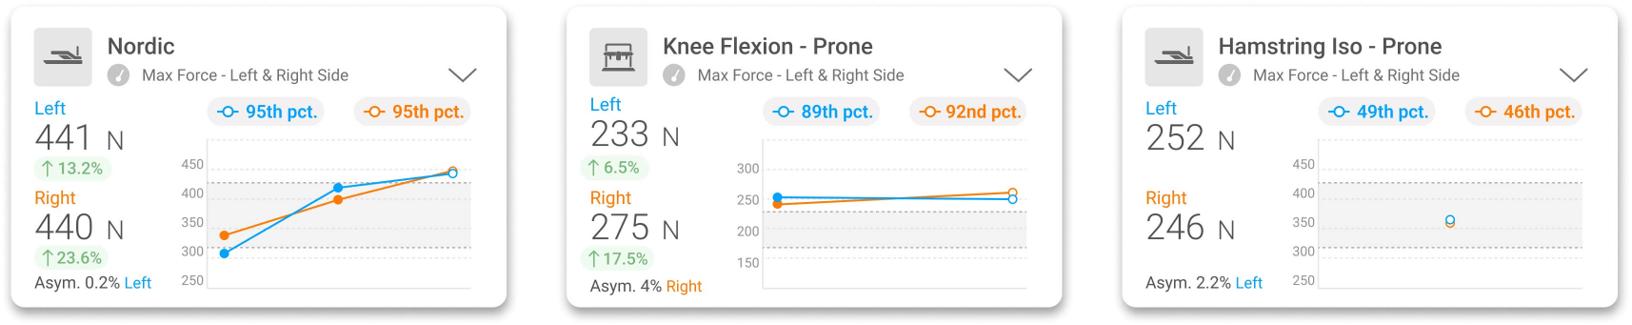
Example of an athlete scoring in the 89th to 95th percentile on the NHE and Knee Flexion – Prone, but only 46th to 49th on the Iso-Prone.
In practice, results like these often redefine the focus of rehabilitation. Guided by test performance, we can direct training stimuli toward the athlete’s specific weakness – addressing the true limiting factor rather than general performance qualities.
Beyond the Numbers
Objective testing provides reliable data, but numbers alone do not tell the full story. How an exercise is performed – and the strategy an athlete uses – can be just as important as the result. Data collection is most powerful when accurate measurement is combined with quality clinical reasoning in the right context.
Data collection is most powerful when accurate measurement is combined with quality clinical reasoning in the right context.
If you are looking to strengthen your approach to hamstring assessment and rehabilitation through objective testing and evidence-based programming, explore our Practitioner’s Guide to Hamstrings. For more information or to integrate VALD technology into your practice, get in touch with our team.
References
- Kerin, F. (2025). T-junction injuries of the biceps femoris: Bridging the gap between expert opinion and evidence-based practice. British Journal of Sports Medicine, bjsports-2025-110012. https://doi.org/10.1136/bjsports-2025-110012