Elite Post-Op Recovery in Soccer: Addressing the force-time curve
Available in:
EN
About the Author
Travis Gaudet is the Co-Owner and Director of Rehabilitation at ORKA Performance, where he works with pro, collegiate and youth athletes, as well as the general population.
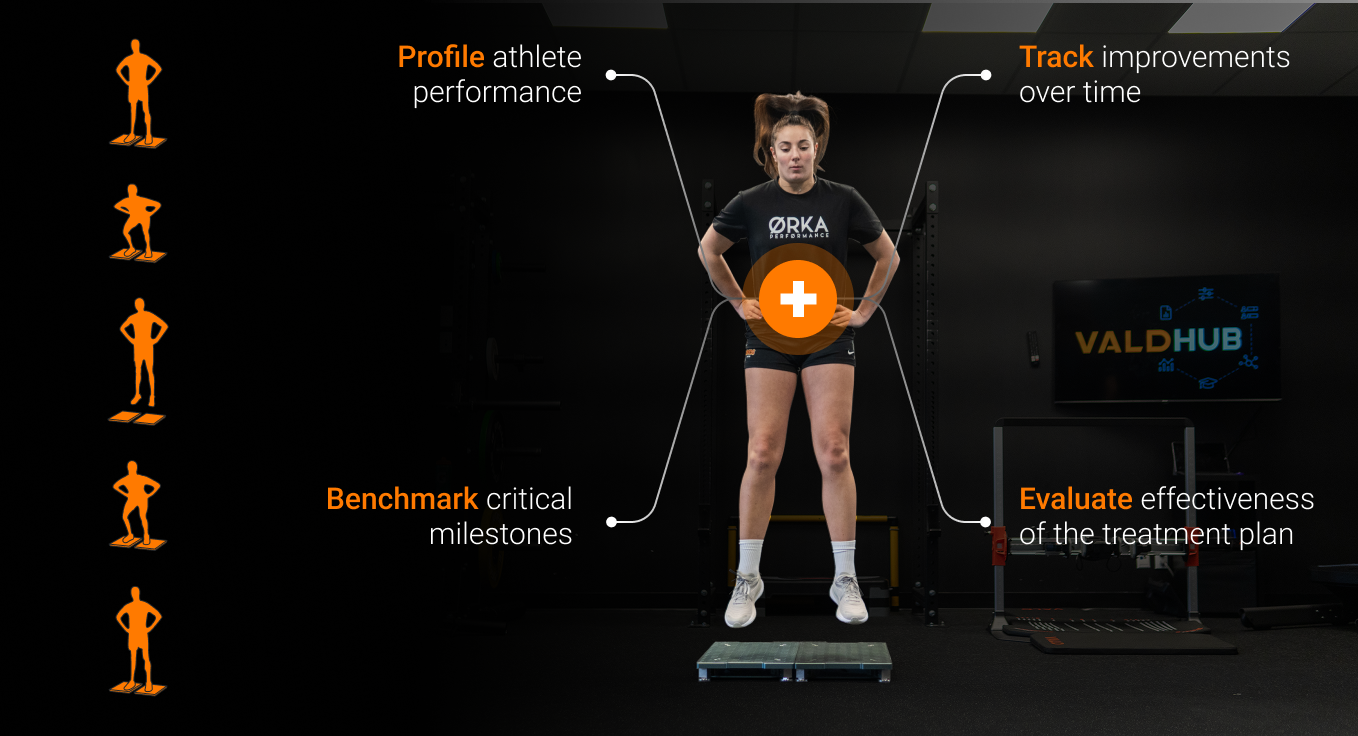
In this article, Travis dives into a case study detailing how he leverages force-time curve characteristics from ForceDecks to inform rehabilitation and bring his athletes back to peak performance. This piece builds on his case study featured in the Practitioner's Guide to ACL, providing further insights into mid-to-late stage anterior cruciate ligament (ACL) rehabilitation.
Context
A 20-year-old female collegiate soccer player sustained a cutting injury to her knee during a league playoff game. The injury occurred in the 79th minute as she planted her leg to execute a subtle change of direction. Subsequent imaging reports confirmed a complete ACL tear, along with a vertical and slightly oblique lateral meniscal tear.
A soccer athlete changing direction on her left leg with common kinematic faults that occur during ACL injury.
She began her rehabilitative journey at ORKA Performance pre-operatively, where we achieved three critical milestones before surgical reconstruction with a bone-patellar-tendon-bone (BPTB) autograft and lateral meniscal repair:
- Full range of motion (ROM) in both flexion and extension.
- Controlled swelling to trace levels (small effusion bulge during sweep test).
- Isometric quadriceps asymmetry <20% (40-50th percentile compared to peers).
This case study explores how this athlete's force-time characteristics developed during ACL rehabilitation, highlighting the strategies used to tailor interventions that effectively address the key adaptations needed to enhance physical performance.
Live progressions of countermovement jump (CMJ), squat jump (SJ) and drop jump (DJ) force-time traces throughout an ACL rehabilitation progression.
Approach to Testing, Monitoring and Targeted Exercise Prescription
Vertical jumping is a critical component of ACL rehabilitation, where double-leg (DL) variations are often introduced as early as month four. These tests serve as benchmarks for achieving key milestones, such as return-to-run and return-to-change-of-direction readiness.1

Vertical jump assessments offer an efficient means of profiling performance, monitoring fatigue and evaluating rehabilitation progress, ultimately playing a vital role in the return-to-play decision-making process.
Vertical jump assessments offer an efficient means of profiling performance, monitoring fatigue and evaluating rehabilitation progress…
Rate of force development (RFD) intervals vary depending on the high-intensity sporting action, with high-intensity movements often requiring precise force generation within critical windows of time.
These time intervals are used to help practitioners assess an athlete’s ability to generate the right force at the right time for their sport's demands.
Mid-Stage 1 (4 Months): Vertical jump testing
Before the CMJ and SJ assessments, we first established foundational DL jump competency. After establishing DL squat proficiency, we progressed through early-stage drills on the plyometric continuum targeting eccentric deceleration, concentric propulsion and reactive strength exercises, using cueing and constraints to support motor learning and feedback, as outlined below.
| Month 4 Addressing the Curve: Examples of Prescriptive Stimuli | |||
| Quality |
Eccentric Deceleration
|
Concentric Propulsion
|
Reactive Strength Capabilities
|
| Intervention | |||
…we first established foundational DL jump competency [with] DL squat proficiency…eccentric deceleration, concentric propulsion and reactive strength exercises…
We focused on highlighting correlations between metrics where the results influenced the interventions chosen for an outcome, as athletes approach movement challenges in unique ways, particularly during the early and mid stages of rehabilitation.
Metrics like phase 1 (P1) and phase 2 (P2) concentric impulse and force at 0 velocity show great sensitivity in this population and have remained cornerstone metrics that we have continued to track throughout ACL recovery.
| Category | |||
|
The Outcome
|
Potential Influences
|
Athlete’s Strategy
| |
|
Jump Height (cm)
|
Peak Force (N)
Eccentric Concentric |
Duration (s)
Eccentric Concentric | |
| Metrics | Peak Power / BM (W/kg) |
Impulse (Ns)
Eccentric (Braking and Deceleration) Concentric (P1 and P2) Force at 0 Velocity (N)
|
Eccentric Peak Velocity (m/s)
Displacement at Takeoff (cm)
|
While analyzing early force-time curves, we qualitatively assessed jump strategy whilst keeping expectations for absolute values conservative.
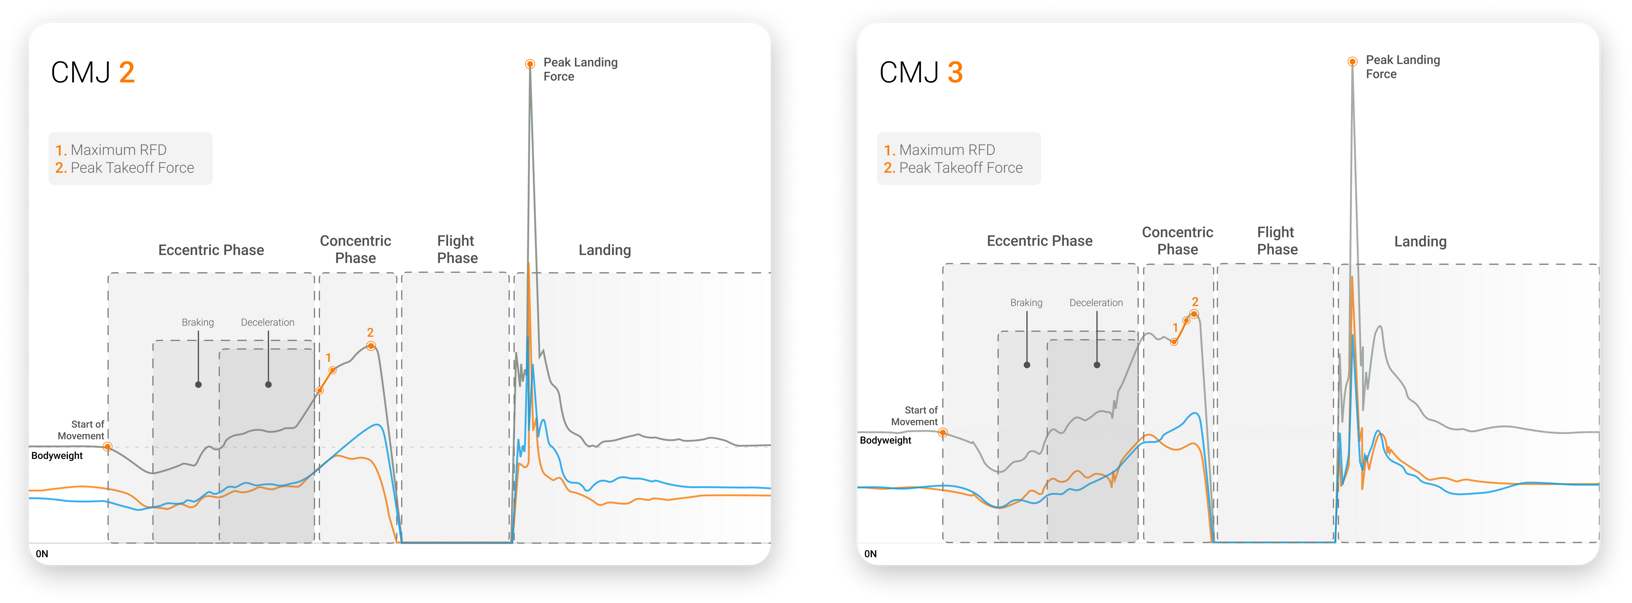
In our first CMJ tested in rehabilitation, poor unweighting (indicative of a slow eccentric peak velocity (EPV)), relatively flat eccentric force slopes and a long eccentric duration (both braking and deceleration) were primary variables to address.
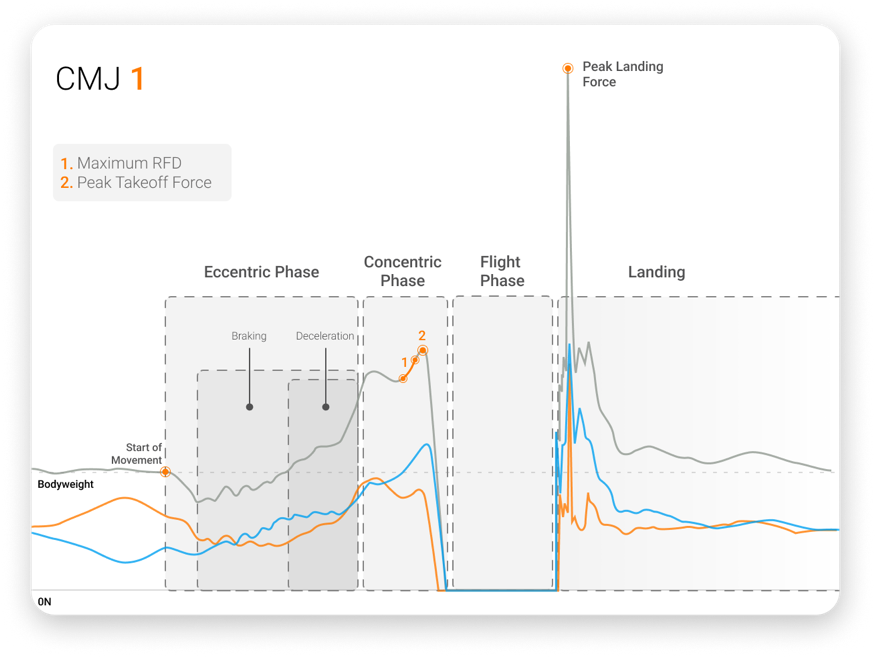
CMJ force-time trace showing deficits in contraction time, unweighting, takeoff asymmetries and overall jumping performance.
Deficits in eccentric deceleration and amortization (force at zero velocity) frequently underpinned challenges the athlete encountered in the concentric phase of the jump.
Deficits in eccentric deceleration and amortization (force at zero velocity) frequently underpinned challenges the athlete encountered in the concentric phase of the jump.
The SJ has been recognized as a test that can be extremely sensitive for anterior graft harvests like BPTB or quadriceps tendon reconstructions. In this case, these deficits were displayed during the last 50% of P1 and all of P2 during takeoff. These results aligned with expectations for mid-stage rehabilitation following ACL reconstruction (ACLR).
The SJ has been recognized as a test that can be extremely sensitive for anterior graft harvests like BPTB or quadriceps tendon reconstructions.
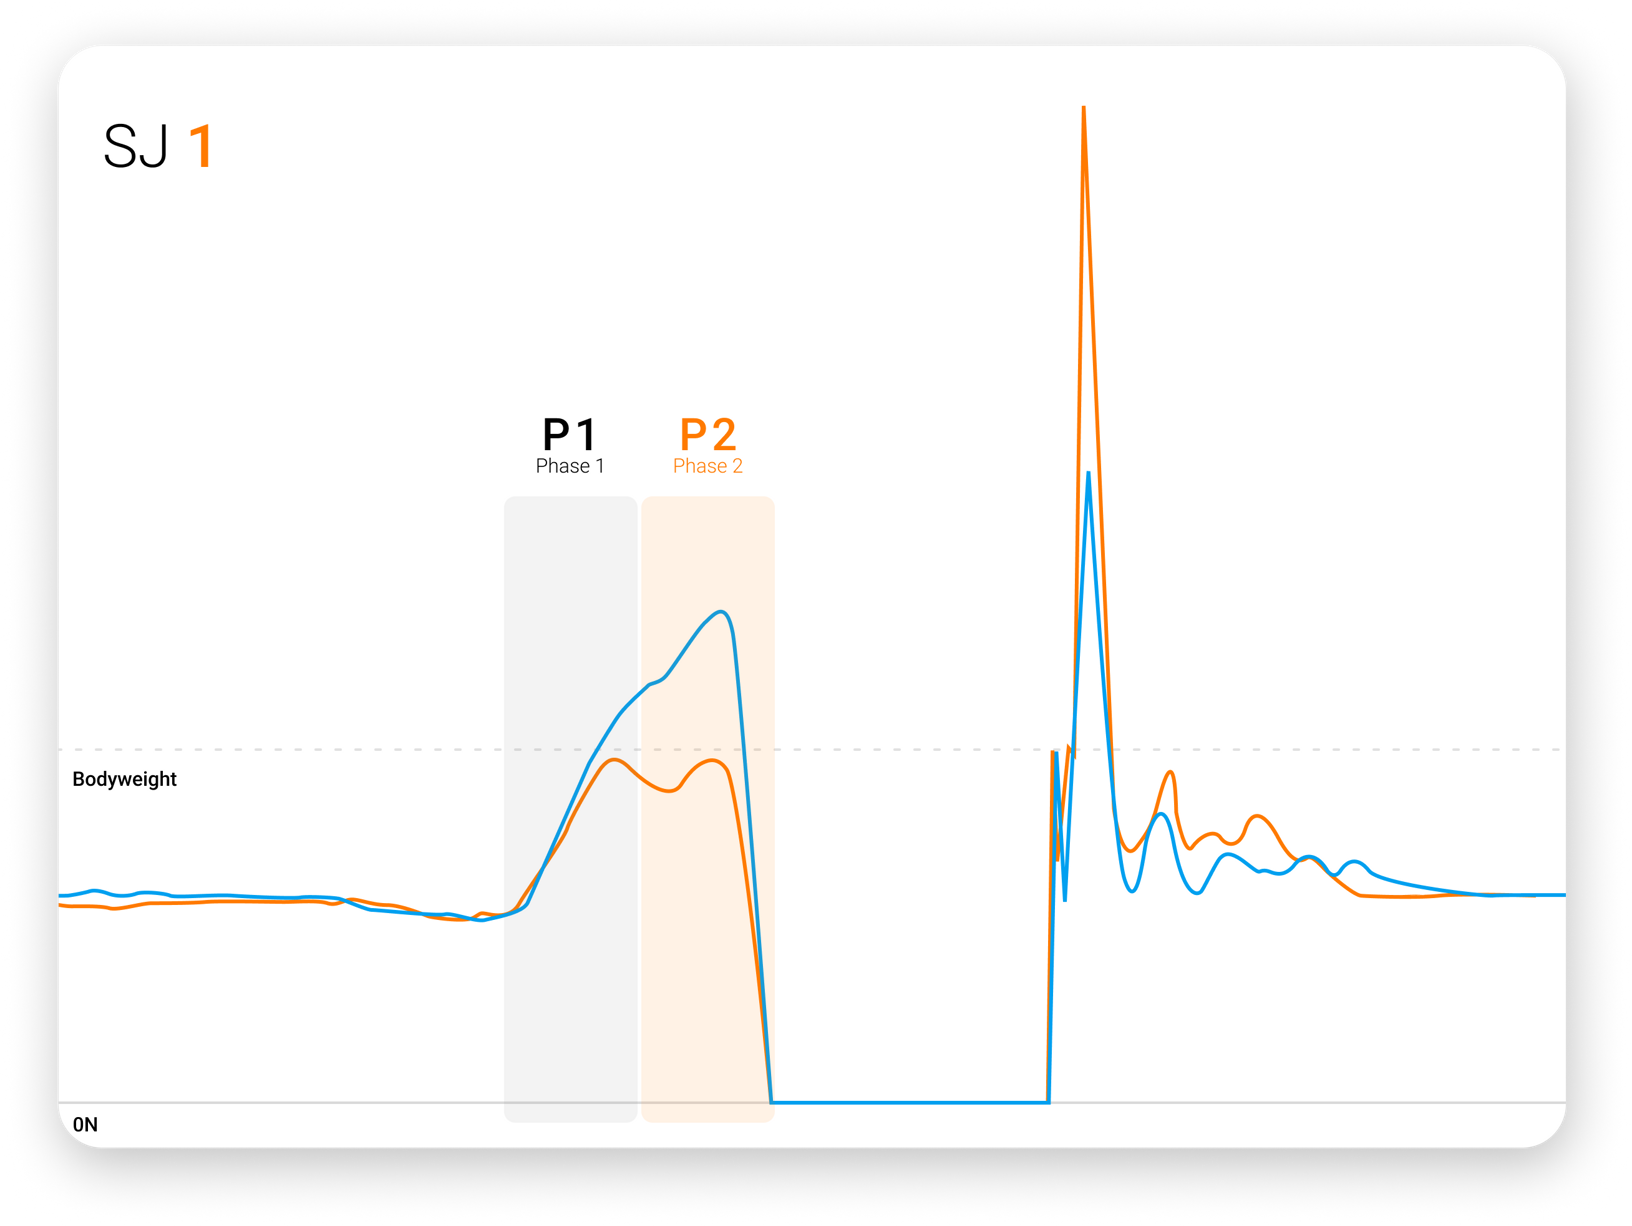
SJ force-time trace showing significant right-sided deficits in P1 and P2 impulse asymmetry.
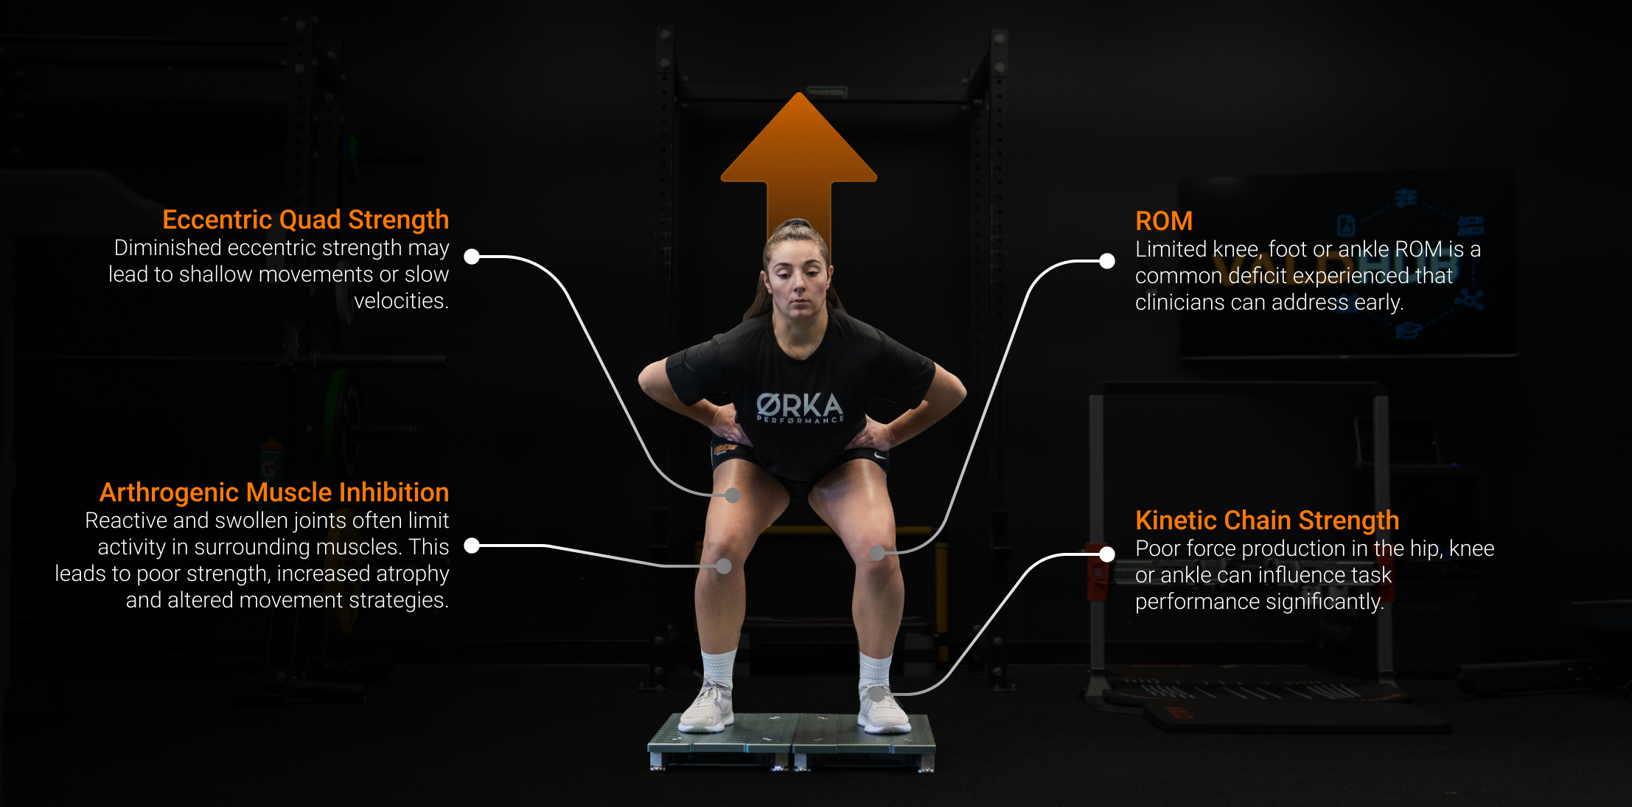
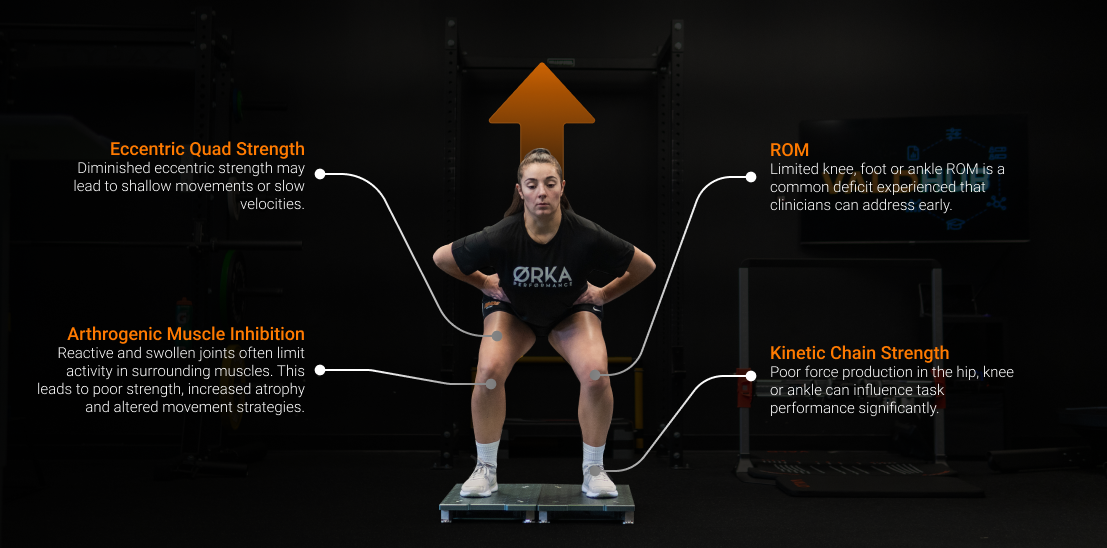
When interpreting data, clinicians need to identify the source of any kinetic, strategy or performance deficits. Commonly, deficits stem from one of the following:
- Lack of knee flexion ROM
- Atrophy of the affected leg
- Poor eccentric quadriceps strength
- Poor ankle dorsiflexion (90% came from the talocrural joint)
- Poor great toe or metatarsophalangeal mobility
- Poor inner range quadriceps, calf or hip extension strength
- Poor toe-off control
This reverse engineering process was crucial for identifying the underlying quality driving the deficit, rather than deficits that appeared due to inefficiencies in other areas. By diving deeper into this analysis, we were better able to remove barriers to performance in a timely manner.
Mid-Stage 2 (5 Months): Vertical jump testing
After completing a four-week mesocycle for maximal strength and hypertrophy, the athlete was tested again. If improvements were minimal or the athlete had a lower training age, the cycle would be repeated.
However, analysis of the force-time curve and force plate metrics showed sufficient adaptation for progression to RFD training. The results and criteria are described below.
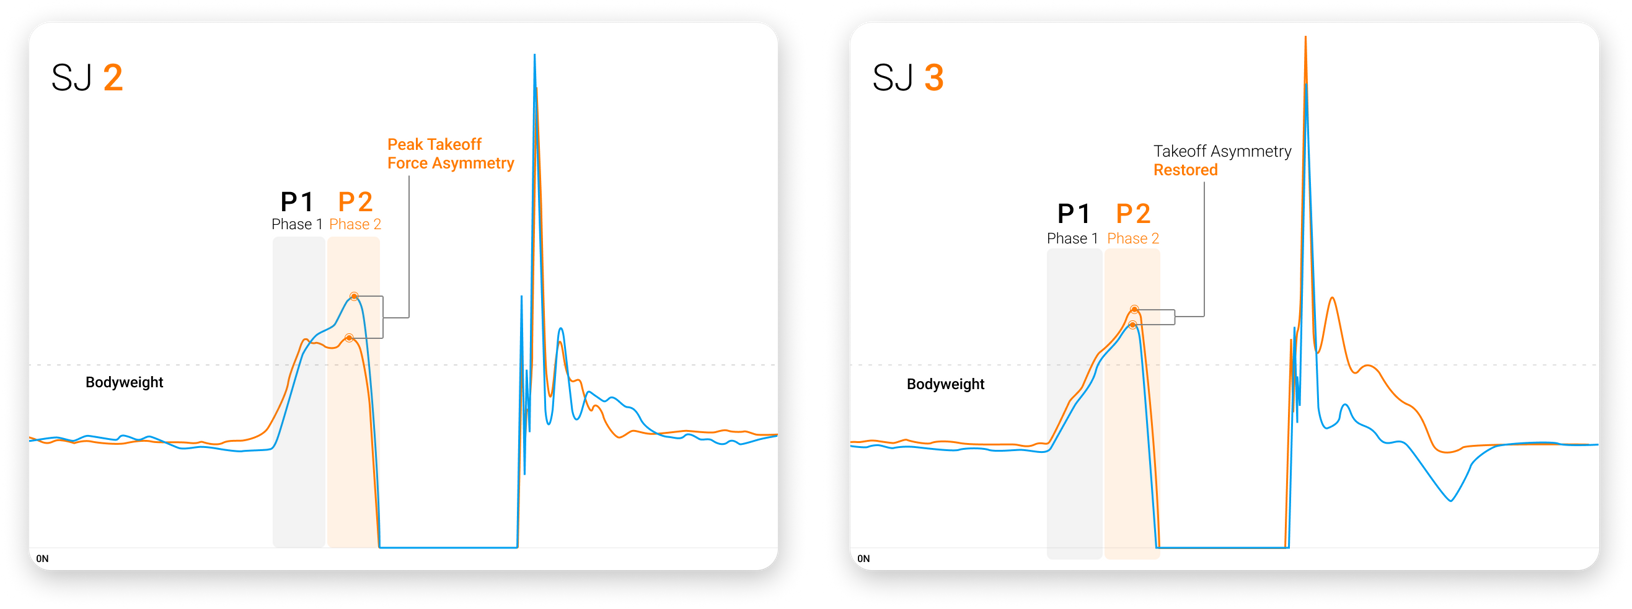
By the end of stages 2 and 3, SJ force-time curves showed steeper RFD traces and improved asymmetry throughout the jump. These benchmarks were tracked to ensure <15% asymmetry in P1 and <20% in P2 concentric impulse.
By the end of stages 2 and 3, SJ…benchmarks were tracked to ensure <15% asymmetry in P1 and <20% in P2 concentric impulse.
For the CMJ, we expected increased jump height and peak power, which could be benchmarked against peers using Norms in VALD Hub.
Improvements in eccentric quadriceps control, knee flexion ROM and ankle dorsiflexion had to be evident in isolated and integrated assessments for the athlete to progress.
With the following training prescription, we observed noticeable changes in jump strategy, such as a deeper countermovement, faster eccentric velocity, enhanced takeoff displacement, shorter takeoff durations and improved symmetry in force production at zero velocity.
| Month 5 Addressing the Curve: Examples of Prescriptive Stimuli | |||
| Quality |
Eccentric Deceleration
|
Concentric Propulsion
|
Reactive Strength Capabilities
|
| Intervention |
SL pogos over a band (forward/backward)
| ||
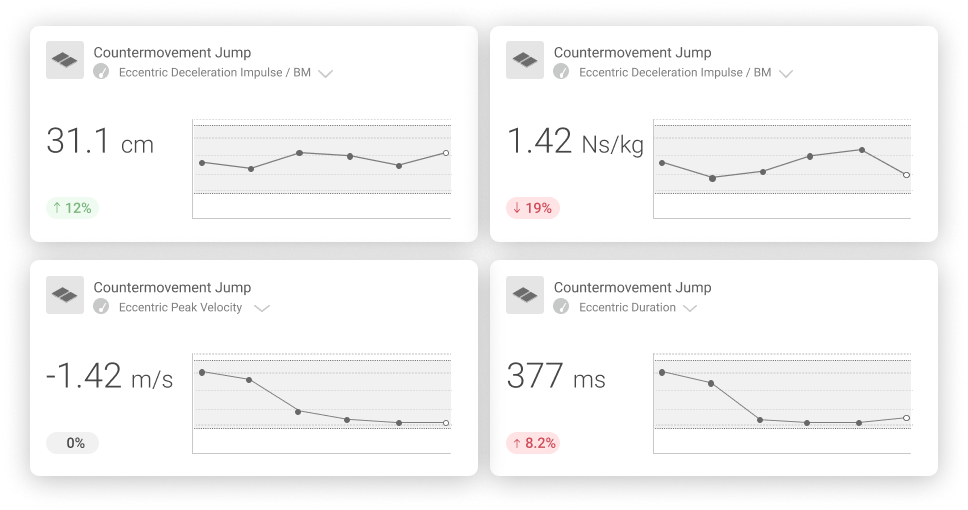
View multiple metrics from a single test type in VALD Hub, allowing practitioners to track key metrics together.
The DJ was introduced to assess reactive strength in a fast stretch-shortening cycle (SSC) task. Compared to age-matched norms in VALD Hub, jump height and reactive strength index (RSI) were reduced. Most notably, there was a pronounced impact peak in the first 20% of ground contact, something often attributed to a higher injury risk.2
A smooth, inverted-U shape of a DJ force-time curve is recognized as a common indication of a good spring-like function of the lower body. This shape is typically used as a target for end-stage rehabilitation and reflects optimal transfer from rapid muscle lengthening to shortening and improved SSC efficiency.
A smooth, inverted-U shape of a DJ force-time curve is recognized as a common indication of a good spring-like function of the lower body.
The high-impact peak and subsequent contact trough from her first DJ indicated a lack of preparation for fast SSC tasks.
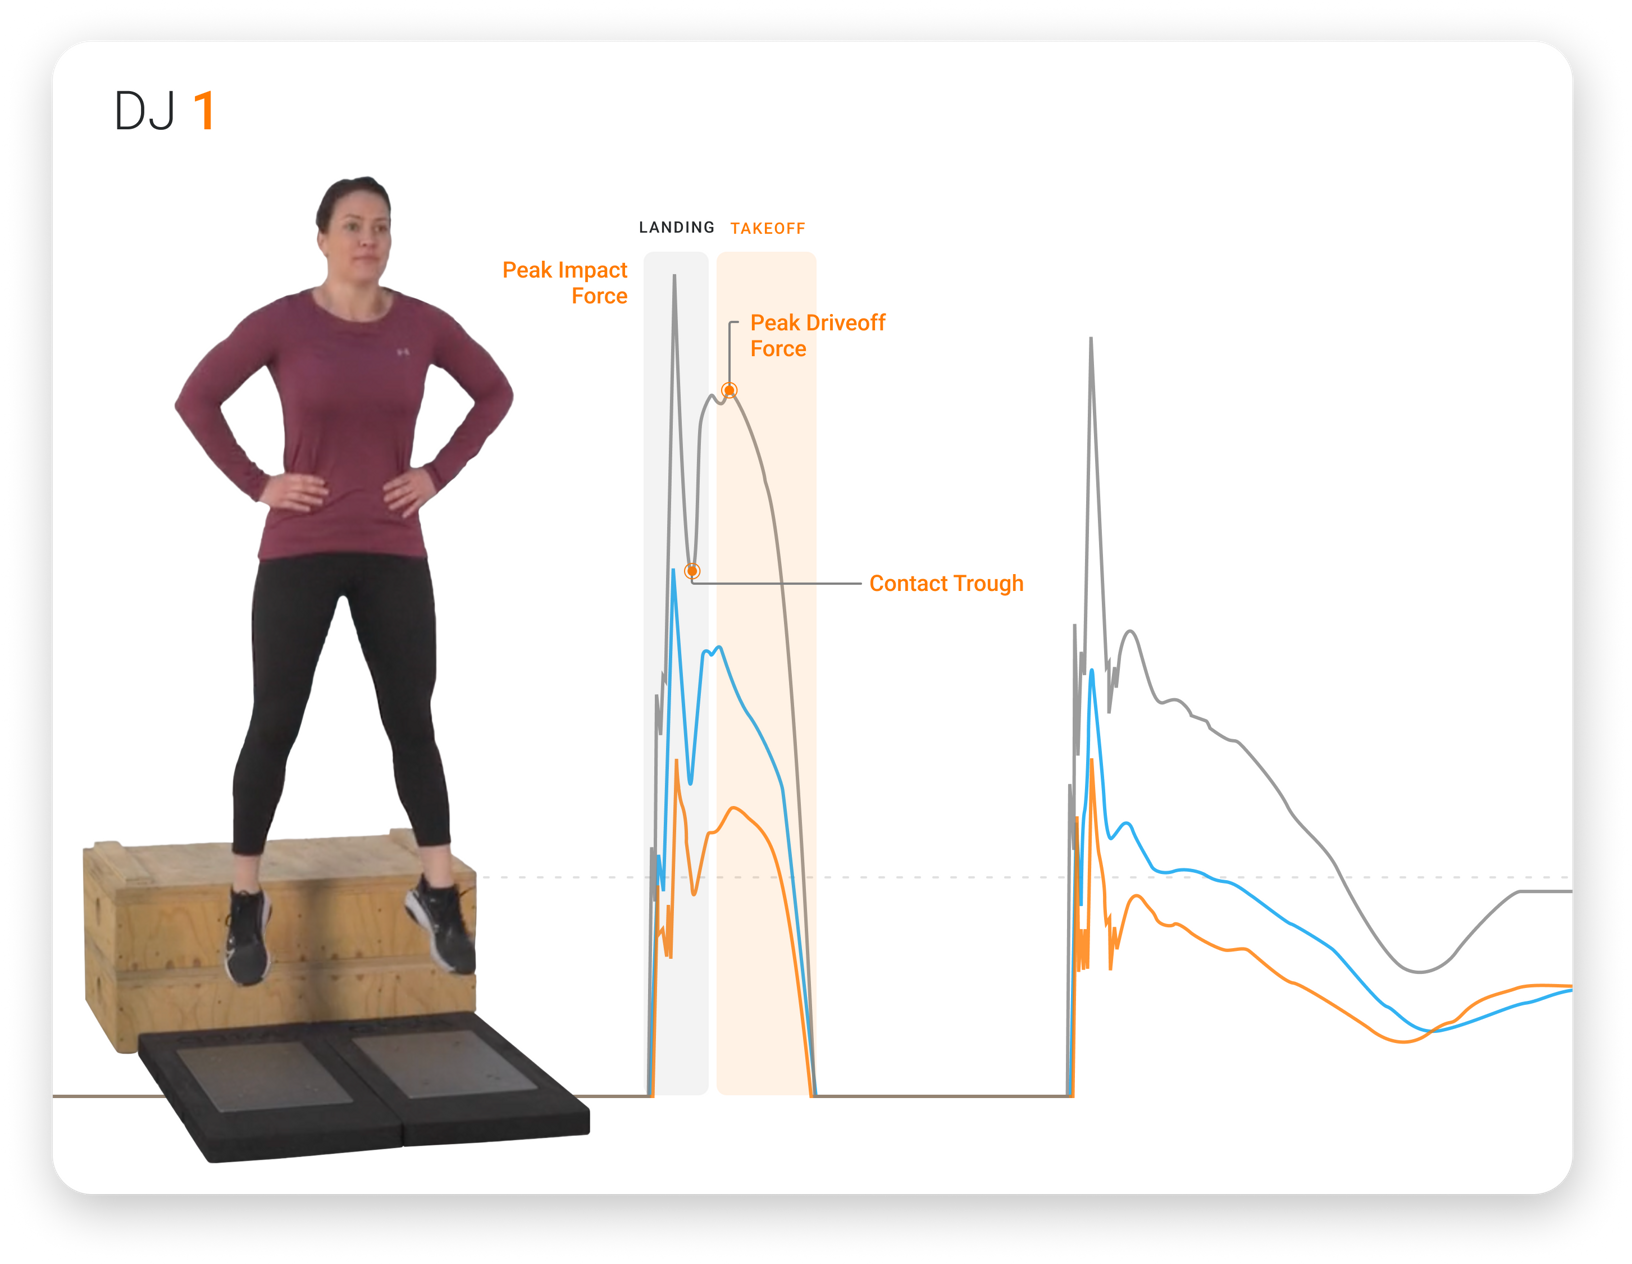
An athlete performing a DJ assessment, showing force trace deficits representative of mid-stage ACLR rehabilitation.
We identified potential deficits contributing to this presentation, concluding they may stem from:
- A reduction in vertical foot or ankle stiffness and poor ankle dorsiflexion control.
- A quadricep stiffening strategy.
- Inadequate strength endurance (measured via SL calf capacity for reps).
- Inadequate maximal strength measured via a seated calf test on ForceFrame or ForceDecks and the Run-Specific Ankle Iso-Push relative to suggested benchmarks.
From our assessments, we determined that the athlete’s DJ performance was underpinned by a combination of ankle and knee stiffness characteristics. Therefore, we introduced greater levels of quadriceps and calf isometric and plyometric training to better prepare the athlete for fast SSC performance.
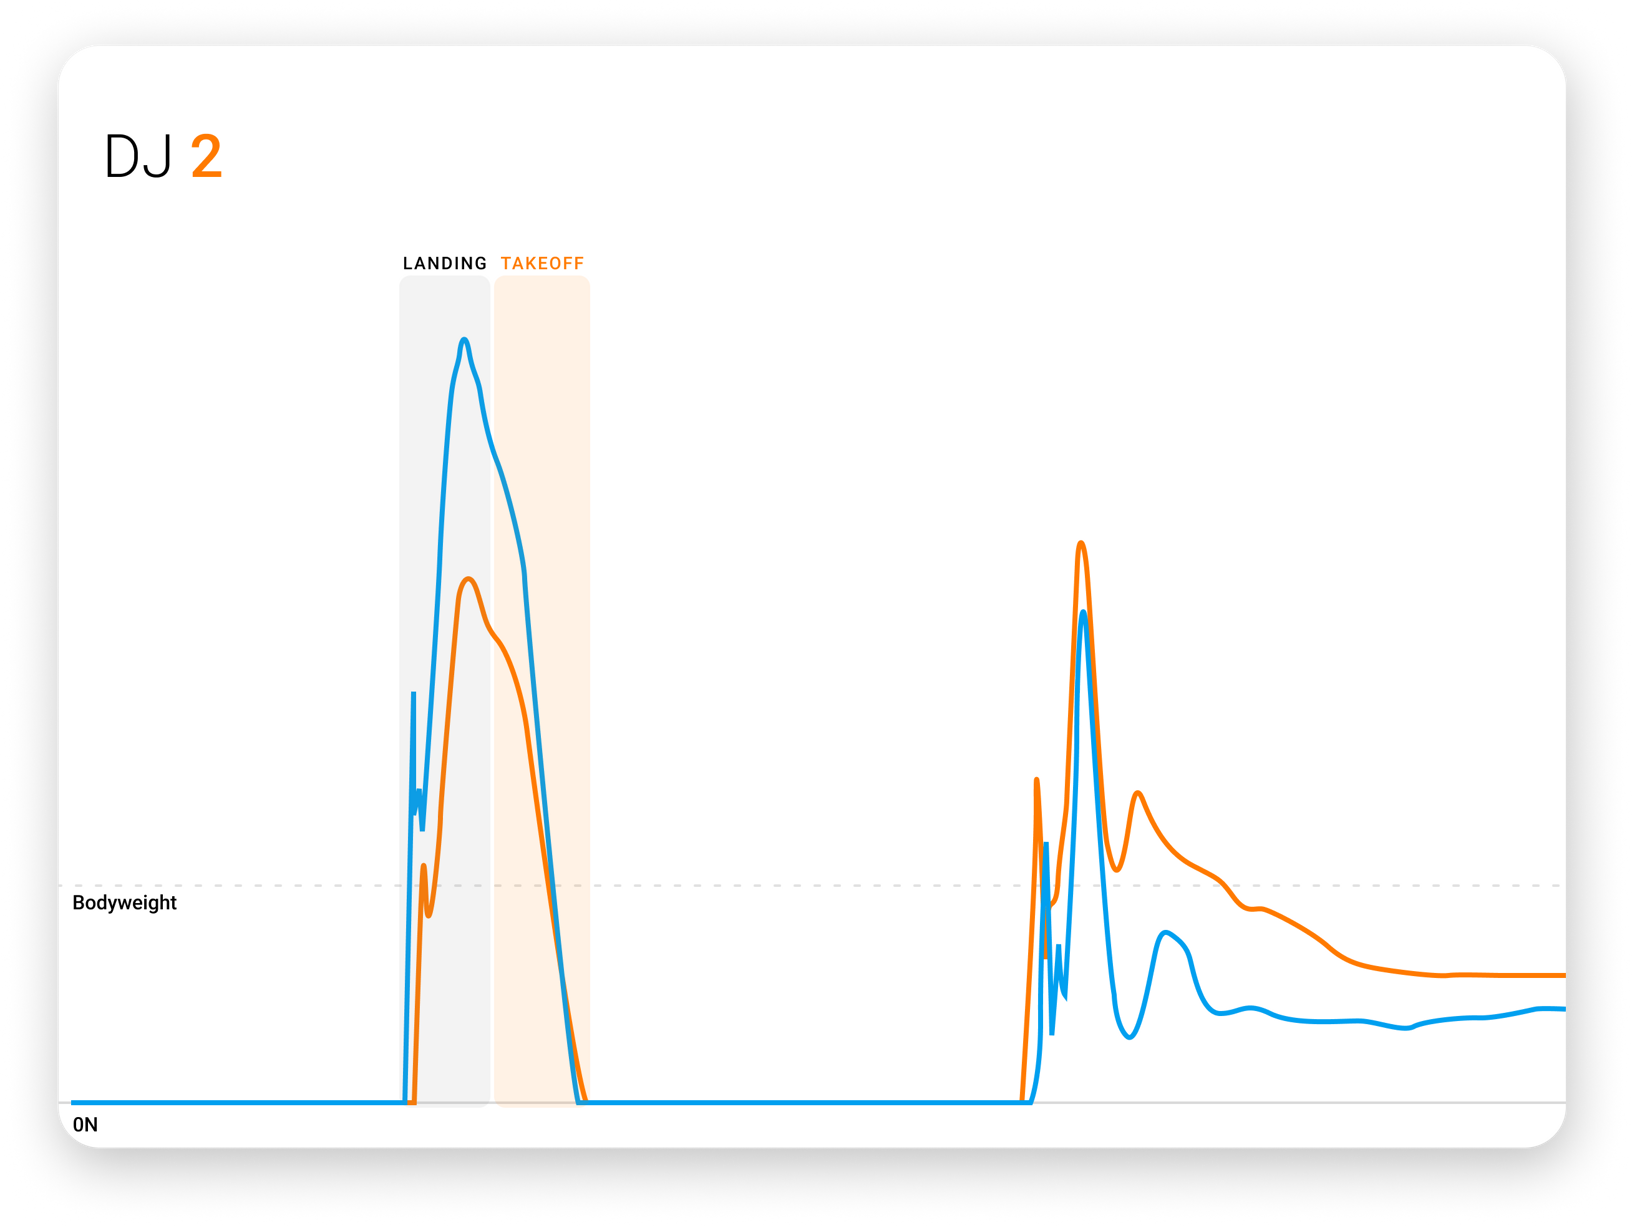
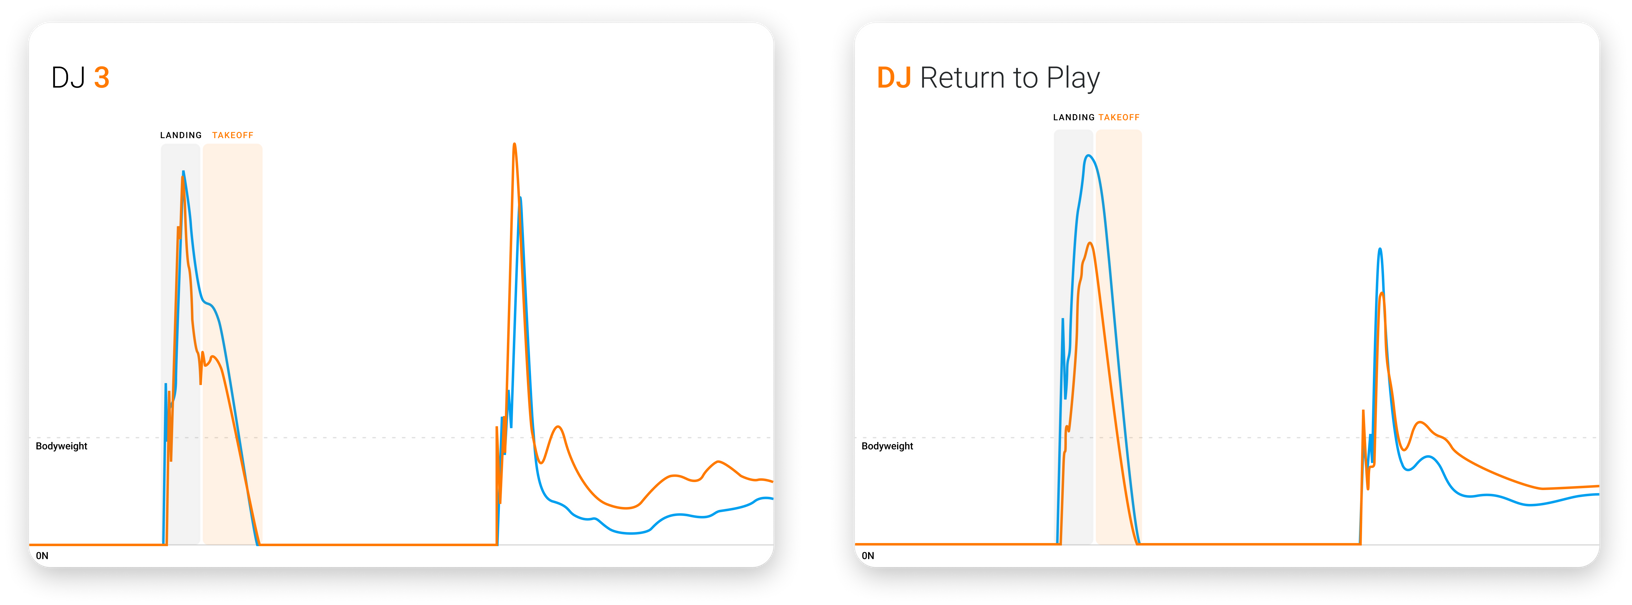
A DJ force-time curve displaying improvements in jump strategy (shorter ground contact time) and performance (greater jump height).
At this point, insights revealed similarly inadequate values in jump height and RSI, however, we noticed a diminishing impact peak, indicating we were on the right trajectory.
As Read et al3 highlighted, we were cautious in relying solely on RSI to assess progress, as improvements in RSI could occur even when the athlete still showed deficiencies in ground reaction force and SSC function.
…we had to be cautious…as improvements in RSI could occur even when the athlete still showed deficiencies in ground reaction force and SSC function.
Common hypotheses at that time often surrounded foot and ankle deficits in stiffness, endurance or peak force compared to benchmarked data rather than asymmetry values. The assessment of these characteristics was considered important in highlighting trainable actions for end-stage training.
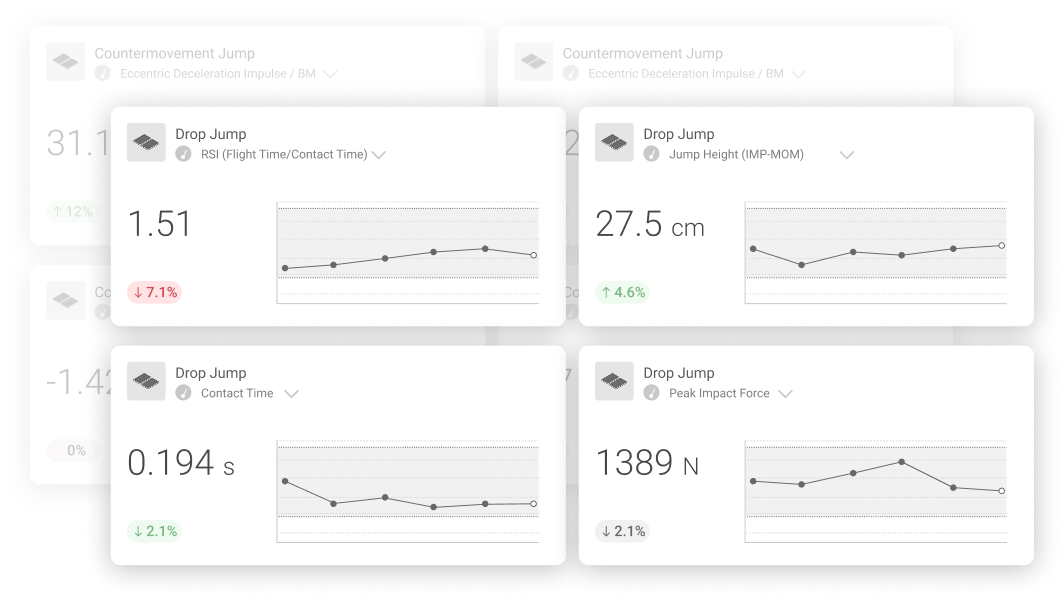
Observed changes in fast SSC function highlighted through DJ metric tiles in VALD Hub.
End Stage (7 Months): Vertical jump testing
By month seven post-ACLR, the athlete had successfully re-integrated into sport-specific training after passing criteria, which included <20% asymmetry in concentric or eccentric impulse in the DL CMJ or DJ and <20% RSI asymmetry in the single-leg drop jump (SLDJ).
This involved transitioning from linear movements (running) to multi-planar skills (change of direction) and progressing through the “control-chaos continuum” while also attending restricted technical training under the guidance of the rehabilitation and performance team.
In the gym, our focus shifted to increasing variability within force-velocity training by emphasizing neurocognitive challenges within sport-specific loading schemes. This included incorporating variability through task constraints and perturbations, targeting skills such as attention, pattern recognition, anticipation, decision-making and visual disruption.
Training also integrated a range of cues – visual, auditory, tactile – and incorporated multi-planar, evasive tasks to further enhance situational exposure with eyes on a return to sport.
| Month 7 Addressing the Curve: Examples of Prescriptive Stimuli | |||
| Quality |
Eccentric Deceleration
|
Concentric Propulsion
|
Reactive Strength Capabilities
|
| Intervention |
Banded DL broad jump to SL landing (overload)
Weighted altitude drops with stroboscopic goggles |
Bulgarian split squat jump in response to color or flashing arrow
DL CMJ to SL landing with therapist perturbation
|
SL tuck jump
DJ variations
|
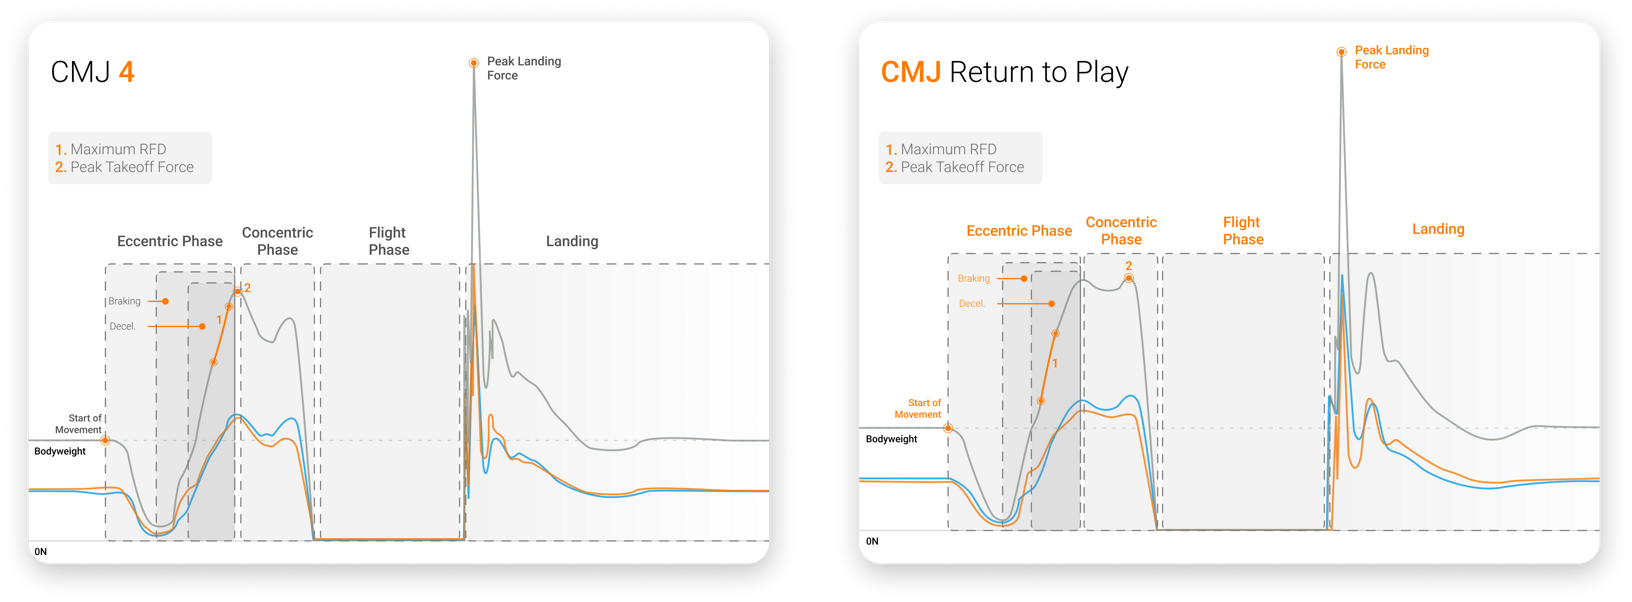
When we revisited the characteristics of the DJ force-time curve, we began to see the athlete show improvement in their ground reaction force characteristics during both the eccentric (negative work) and concentric (positive work) phases of the test as the curve gradually shifted toward the desired inverted U-shape.
Improvements in RSI were also noted, driven by increases in jump height and reductions in ground contact time.
A key focus was ensuring the peak impact force reduced in the initial 20% of the ground contact phase over time, eventually leading to a smooth transition between landing and takeoff as the ground reaction forces began to reflect the center of mass (CoM) displacement and peak force that occurred at the midpoint of ground contact.
A key focus was ensuring the peak impact force reduced in the initial 20% of the ground contact phase over time, eventually leading to a smooth transition between landing and takeoff.
Key Takeaways and Summary
Vertical jump testing and force plate analysis are central to the return-to-play decision-making process following ACLR, serving as invaluable tools for identifying lingering deficits that require targeted interventions.
By consistently tracking these metrics, practitioners can ensure that prescribed stimuli drive the appropriate adaptations over time and verify whether the rehabilitation program effectively addresses the outlined key performance indicators.
Interpreting force-time curve characteristics, pinpointing key deficiencies and making data-driven programming decisions aid in practitioners’ abilities to address core competencies impacting rehabilitation or performance deficits.
If you are interested in learning how VALD’s human measurement technology, including tools like ForceDecks, can support effective ACL rehabilitation and enhance your athletes' return to peak performance, explore our Practitioner's Guide to ACL. For more information or to integrate VALD technology into your practice, reach out here.
References
- Marques J, Jankielson S. What tests and what variables do I need to assess and how to target them in rehab. Volume 12 - Targeted Topic - Rehabilitation After ACL Injury. Aspetar Sports Medicine Journal. Accessed January 31, 2025. Available at: https://journal.aspetar.com/en/archive/volume-12-targeted-topic-rehabilitation-after-acl-injury/CHANGE-OF-DIRECTION
- Pedley JS, DiCesare CA, Lloyd RS, et al. Maturity alters drop vertical jump landing force‐time profiles but not performance outcomes in adolescent females. Scand J Med Sci Sports. 2021;31(11):2055-2063. doi:10.1111/sms.14025
- Read PJ, Pedley JS, Eirug I, Sideris V, Oliver JL. Impaired stretch-shortening cycle function persists despite improvements in reactive strength after anterior cruciate ligament reconstruction. J Strength Cond Res. 2022;36(5):1238-1244. doi.org/10.1519/jsc.0000000000004208