ForceDecks Validity and Reliability
Study Information
Collings, T. J., Lima, Y. L., Dutaillis, B., & Bourne, M. N. (2024). Concurrent validity and test–retest reliability of VALD ForceDecks’ strength, balance and movement assessment tests. Journal of Science and Medicine in Sport, 27(8), 572–580.
https://doi.org/10.1016/j.jsams.2024.04.014
Link to the online report containing all test and metric results: Reliability and Validity (tylercollings.github.io)
Purpose of the Study
This study aimed to evaluate the reliability and concurrent validity of VALD’s ForceDecks Dual Force Plate System against gold standard laboratory force plates across a range of common performance monitoring and rehabilitation-focused assessments.
Primary Objective: Quantify ForceDecks’ accuracy in measuring ground reaction forces (GRF) and center of pressure (COP) across a variety of:
- Dynamic tests
- Isometric tests
- Balance tests
Secondary Objective: Identify metrics with optimal and suboptimal validity and reliability, helping to educate users about which metrics are more and less reliable in practice.
Methods
Sixteen university students participated in the study ‒ ten males and six females, aged 18-40, all physically active and injury-free. Each participant underwent a series of tests to evaluate the concurrent validity of ForceDecks and AMTI force plates.
Two identical sessions were conducted one week apart to understand the test-retest reliability of both sets of force plates. These sessions incorporated twelve balance, dynamic and isometric tests using ForceDecks software, including:
- Quiet Stand
- Single Leg Range of Stability
- Squat Assessment
- Countermovement Jump (CMJ)
- Squat Jump (SJ)
- Drop Jump (DJ)
- Hop Test
- Single Leg Hop Test
- Shoulder ISO-I
- Shoulder ISO-Y
- Shoulder ISO-T
- Isometric Mid-Thigh Pull (IMTP)
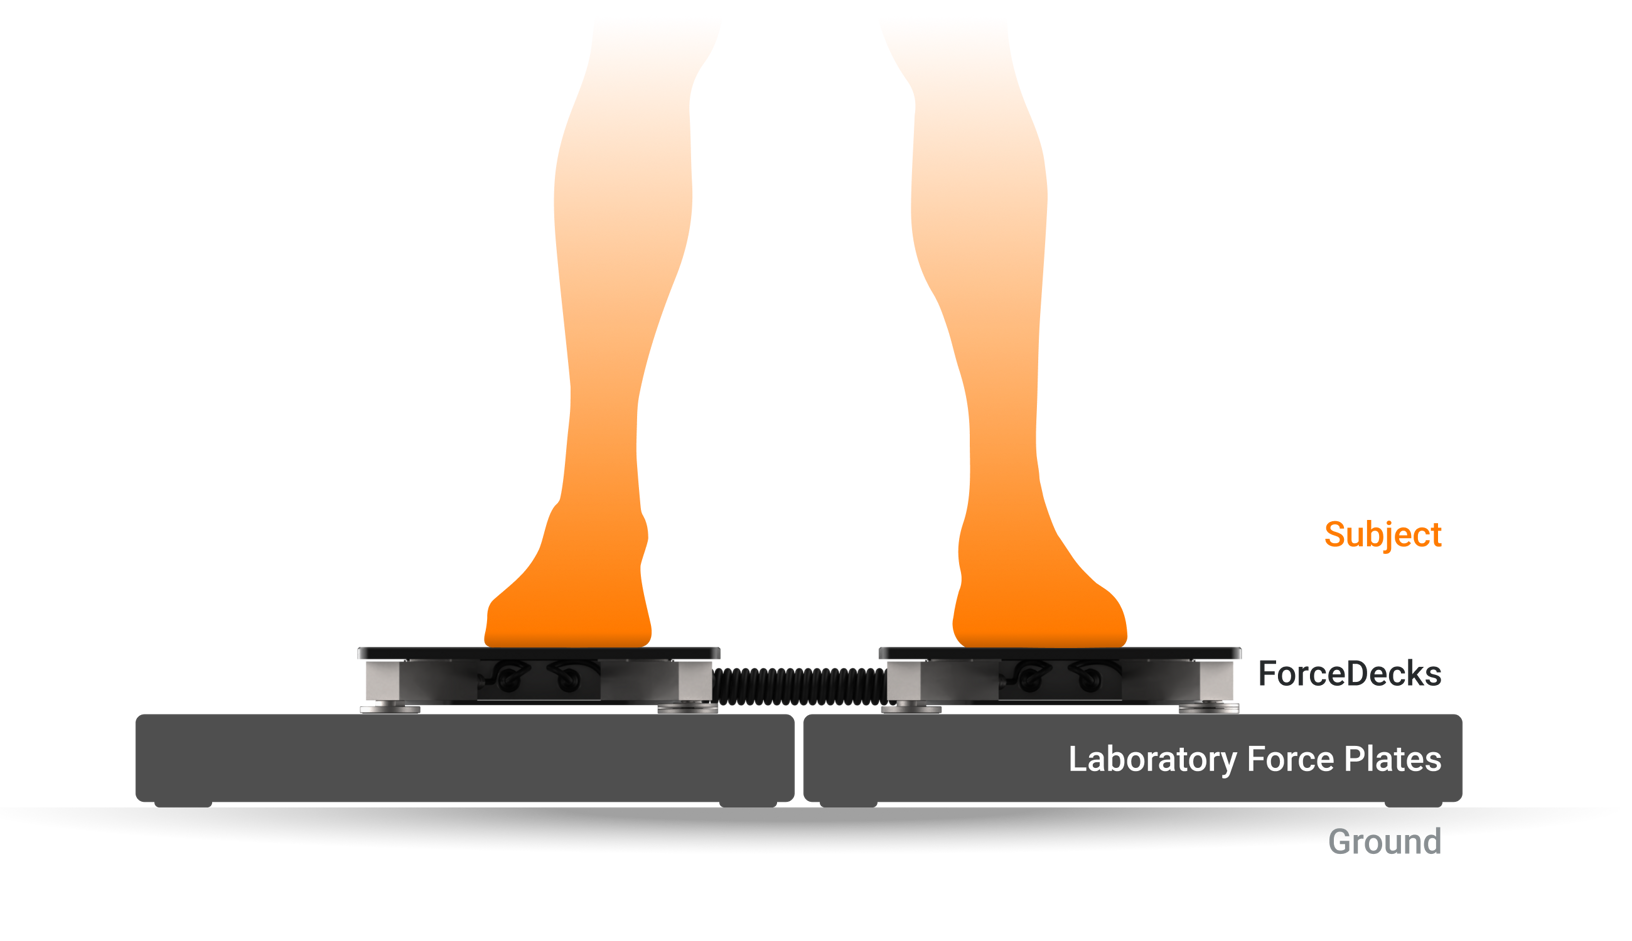
ForceDecks were placed atop the AMTI plates to enable concurrent recording from ForceDecks and AMTI plates at 1,000Hz. Force traces from both systems were analyzed directly in ForceDecks software, allowing a direct comparison of all ForceDecks metrics for validity testing. Capturing data at the same frequency from both systems enhanced the accuracy of the comparative analysis.
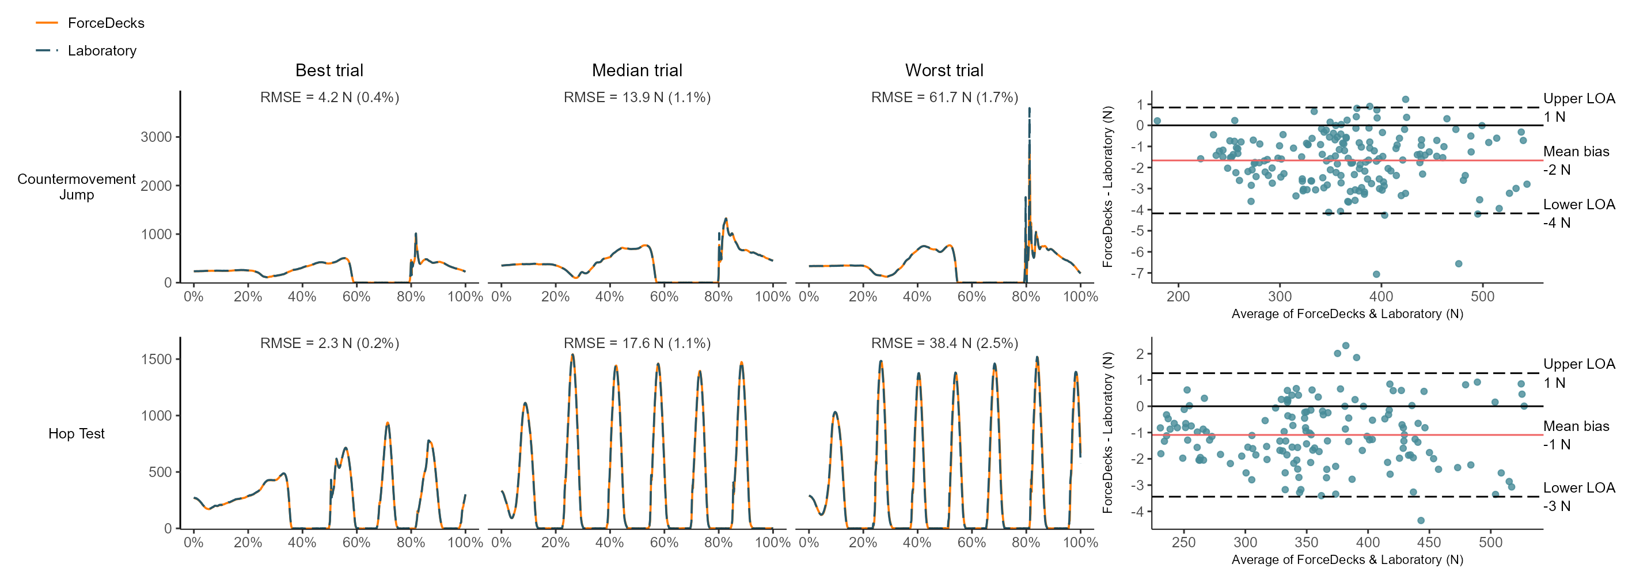
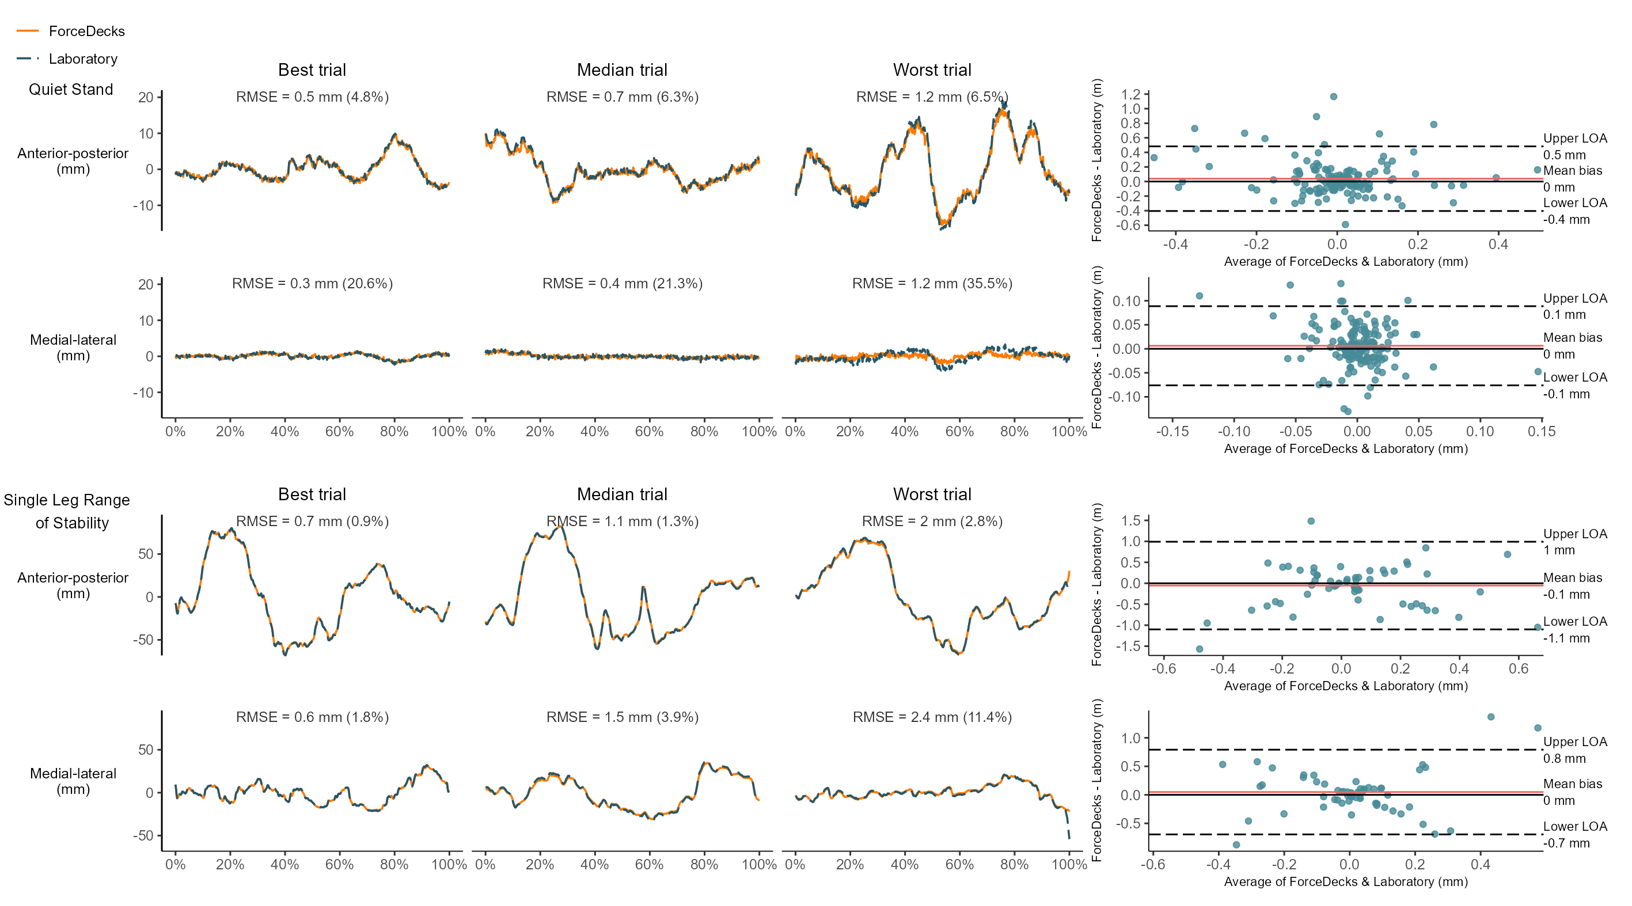
Reliability was quantified using intraclass coefficients (ICC) and validity was assessed through percentage differences, Bland-Altman analysis and Root Mean Square Error (RMSE).
Key Findings
ForceDecks and laboratory plates showed less than 1% difference in over 200 metrics [and] mean bias of under 2.5N (and 0.1mm for COP) across all analyzed tests.
Validity
ForceDecks vs. Laboratory Force Plates
Comparisons between ForceDecks and laboratory plates showed less than 1% difference in over 200 metrics across all tests.
Bland-Altman analysis also confirmed mean biases of under 2.5N (and 0.1mm for COP) across all analyzed tests, demonstrating ForceDecks’ high measurement accuracy.
Reliability
ForceDecks and Laboratory Force Plates: Session 1 vs. Session 2
Metrics such as jump height, peak forces and power output consistently showed ICC values above 0.9, indicating excellent reliability across testing sessions.
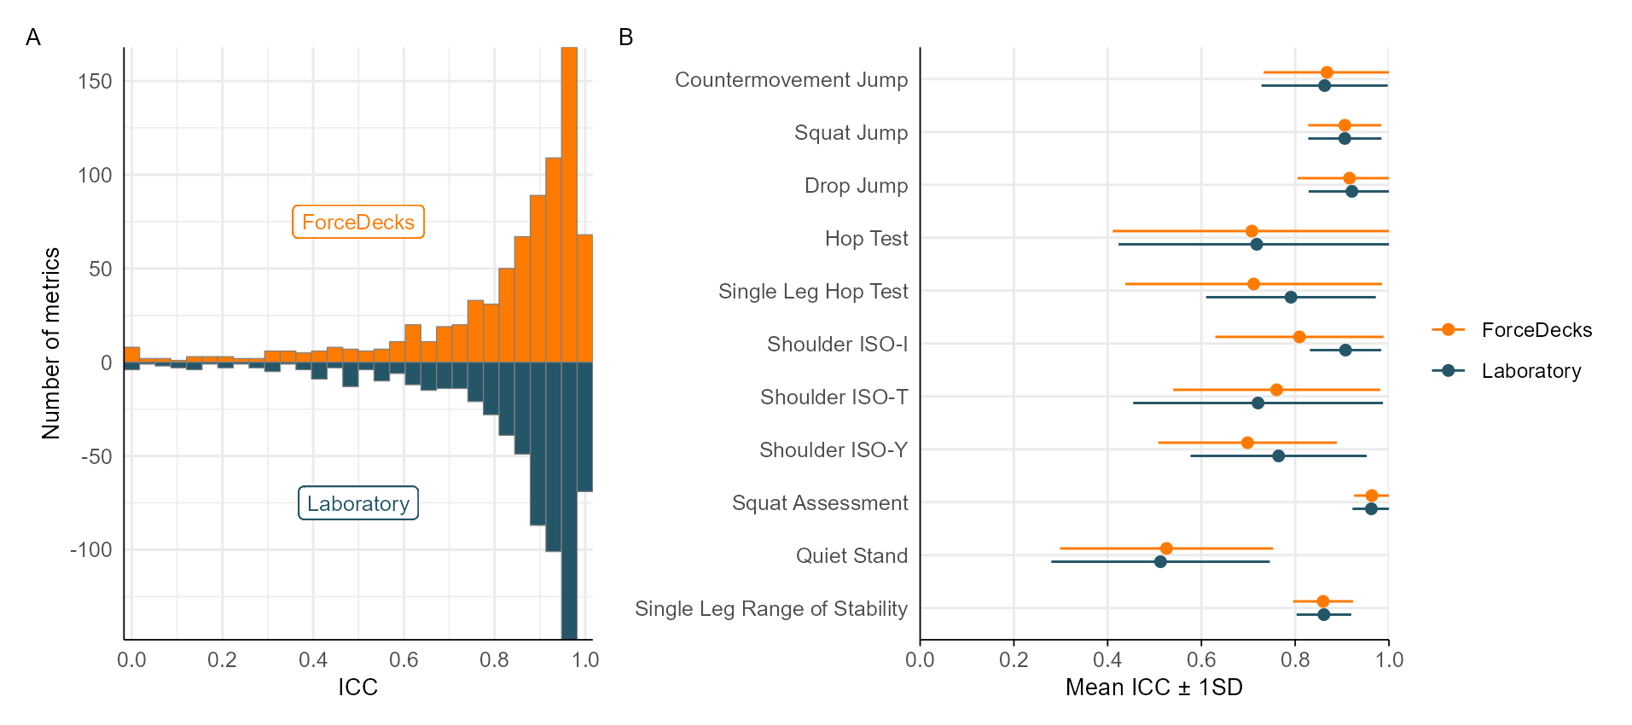
When reviewing the distribution of ICC across metrics, it is obvious that some rate of force development (RFD) and time-based metrics were noticeably less reliable. However, these less reliable metrics were equally unreliable on both ForceDecks and laboratory force plates.
Therefore, it is reasonable to conclude that this is caused by natural inter-session variability in an individual’s performance of the same movement rather than any underlying inaccuracy of the force plates.
VALD’s Solution
The findings of Collings et al. highlight the suitability of ForceDecks for accurate and reliable assessment of GRF and COP. ForceDecks’ excellent concurrent validity and test-retest reliability suggest they are equally suitable as laboratory-grade force plates for performance monitoring, tracking rehabilitation progress and other common applications.
Read the full article or explore the full results.