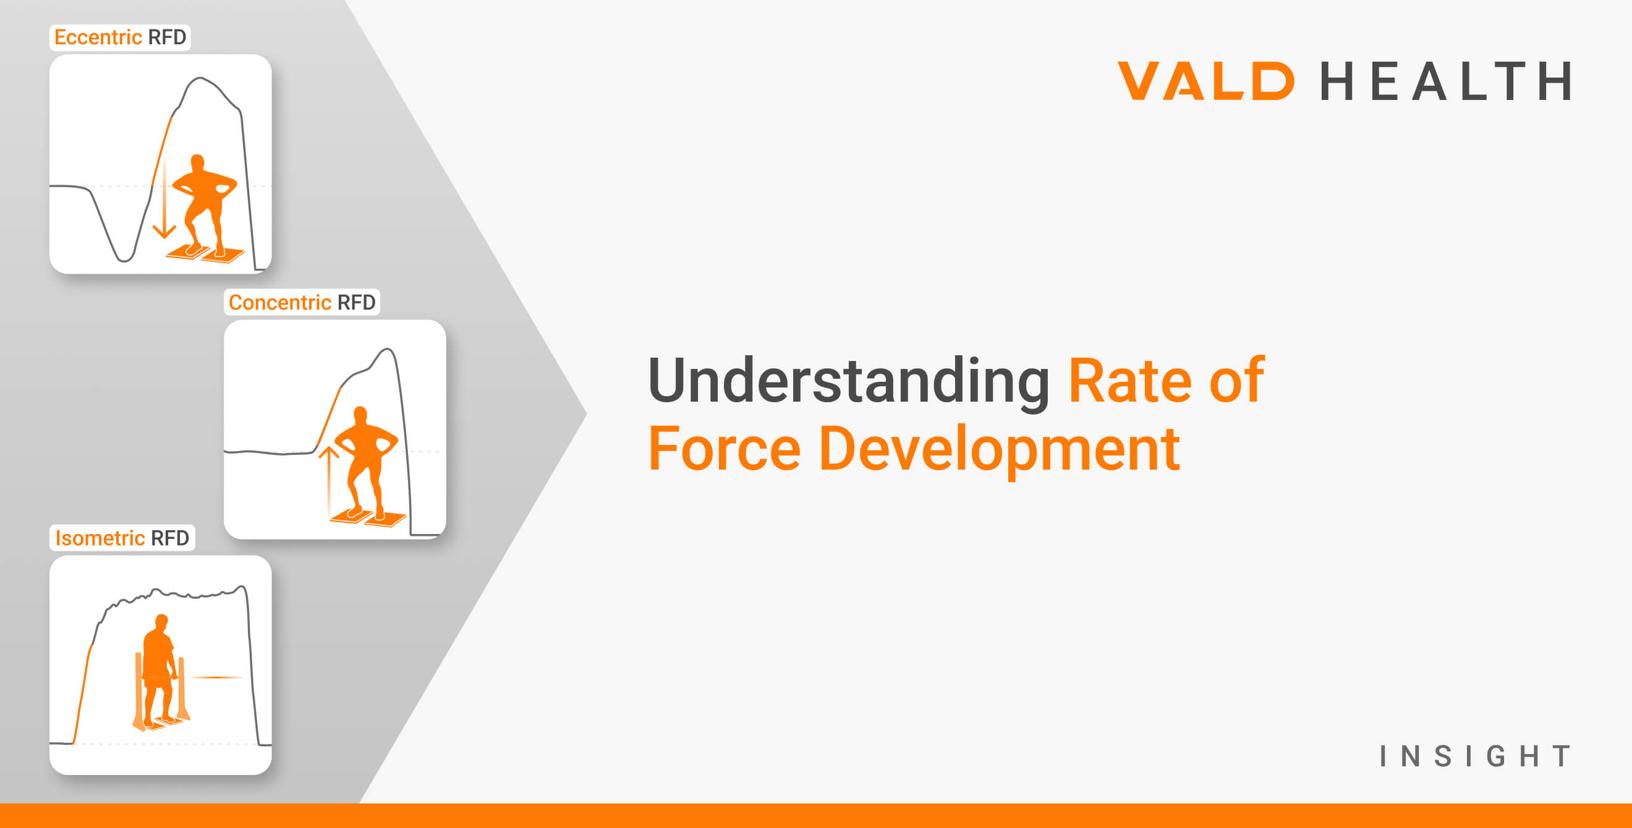
Understanding Rate of Force Development
Rate of force development (RFD) is a measure of time-constrained force production – a distinct neuromuscular quality required for both daily activities and rehabilitation tasks. Unlike peak force, which measures the maximum force a patient can produce, RFD reveals how quickly the force is generated. This temporal component of force production has significant implications for rehabilitation decision-making across diverse patient populations (Tillin et al., 2013).
Despite growing recognition in the sports science literature, some clinicians remain uncertain about RFD’s reliability, assessment methods and clinical utility.
This article provides a framework for understanding RFD measurement, interpretation and application in rehabilitation settings using technologies such as ForceDecks, ForceFrame, NordBord and DynaMo Max.
What RFD Reveals That Strength Testing Does Not
Traditional strength assessments measure peak force, often through maximum voluntary isometric contractions or repetition-maximum assessments. While these insights are valuable for clinicians, strength restoration without corresponding RFD restoration is a lagging indicator of incomplete rehabilitation.
…strength restoration without corresponding RFD restoration is a lagging indicator of incomplete rehabilitation.
When measured isometrically, RFD is a direct measure of explosive strength. While several metrics are used to describe this quality, RFD is the primary construct. Alternative measures like time to peak force or time to 80% of peak force serve as proxies to help interpret how quickly force is produced.
For clinicians seeking greater variety in explosive strength metrics, systems like ForceDecks also provide alternative measures to RFD:
| Metric | Description | Advantage | Disadvantage |
| Time to Peak Force | Time from start of movement to peak force | Simple to interpret and easy for clinicians to understand | Highly variable and influenced by isometric strategy, limiting its relevance to early explosive force qualities |
| Time to 80% Peak Force | Time from start of movement to 80% of peak force | More reliable than time to peak force for assessing rapid force development | May underrepresent true peak explosive capacity |
| Force at Fixed Time Points | Force produced at predefined time points from movement onset (e.g., 50ms, 100ms, 150ms) | Provides a clear indication of loading rate and allows for simpler comparisons due to metric familiarity | Sensitive to execution strategy (e.g., pretension) and clinician cueing, increasing between-trial variability |
| Impulse at Fixed Time Points | Time-integrated force (force × time) from movement onset to a defined time point | Offers insight into task- and sport-specific qualities such as braking and deceleration capacity | More complex to communicate and typically more variable than simpler timing-based RFD metrics |
Consider two patients recovering from total knee arthroplasty, each achieving a peak force of 370N during isometric knee extension testing. Patient A reaches this value in 800ms (0.8s) while Patient B does so in 1200ms (1.2s). In this case, Patient A demonstrates greater RFD than Patient B.
Note: Time to peak force is highly variable and influenced by execution strategy, making it a poor metric for decision-making in isolation (Merrigan et al., 2020). However, the concept of generating more force in less time remains a useful way to understand explosive strength.
In this case, both patients show equivalent strength restoration, yet Patient B’s slower force development may indicate persistent deficits in neural drive or altered motor unit recruitment patterns, potentially increasing fall risk during rapid balance corrections or stair descent (Aagaard et al., 2002; Bento et al., 2010).
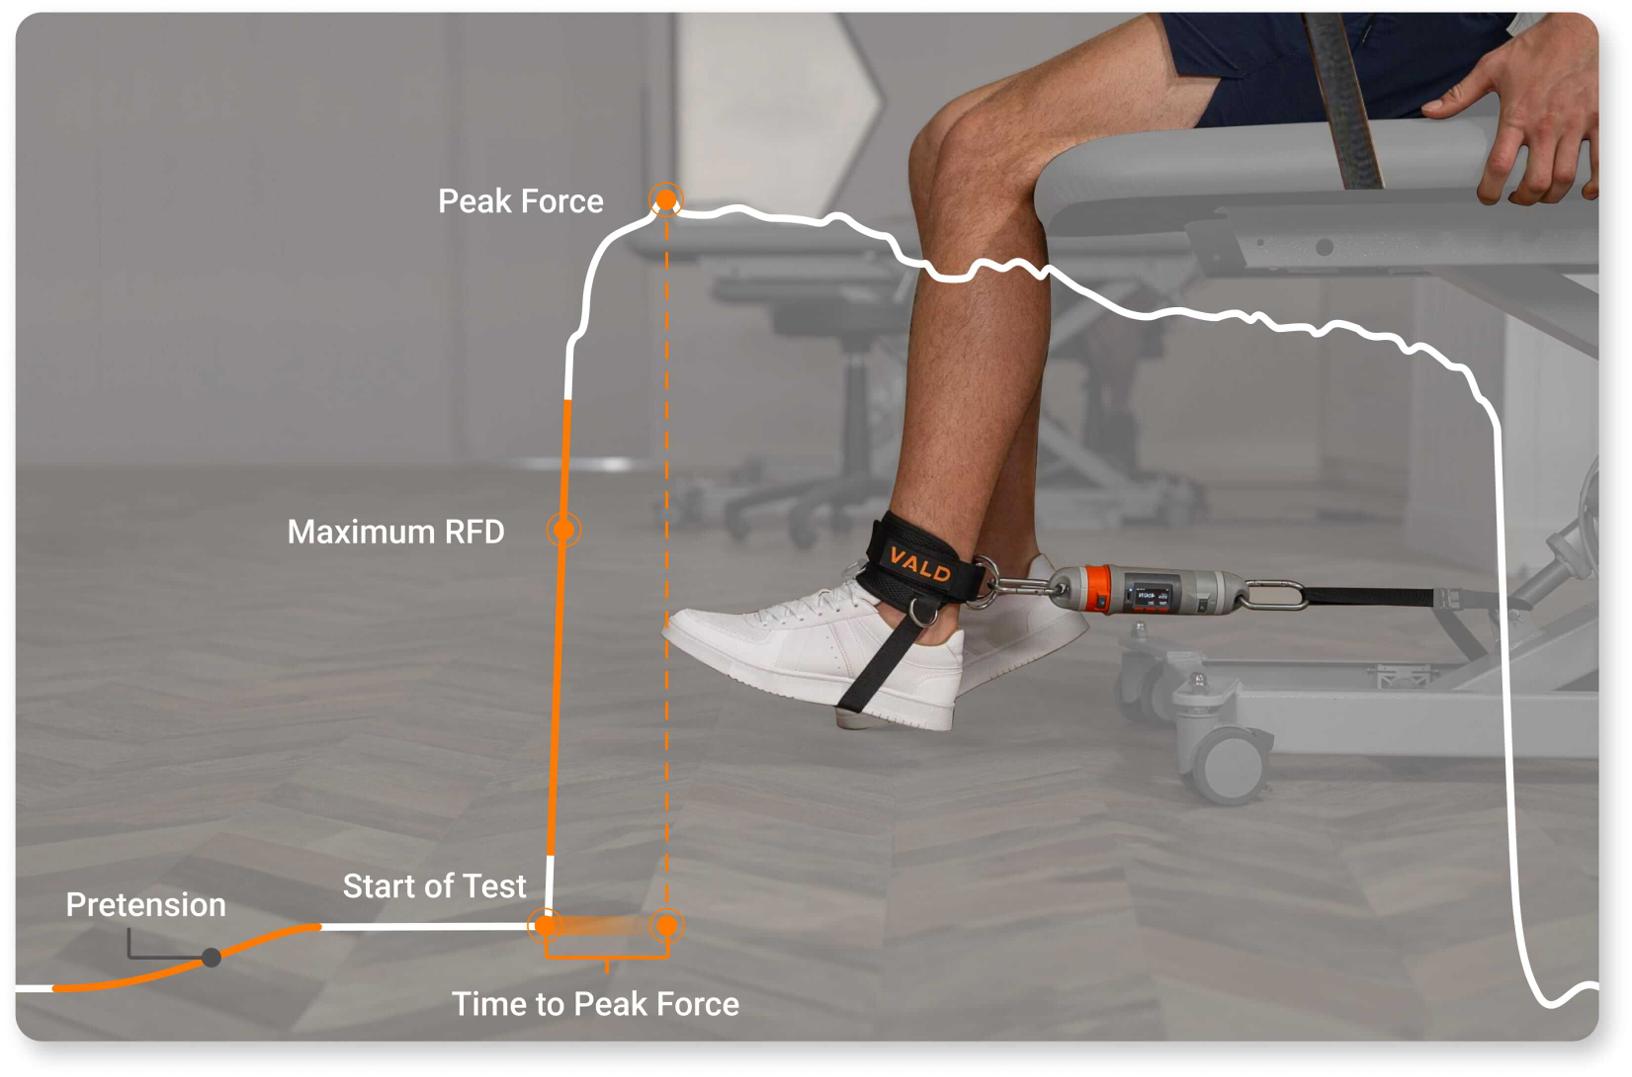
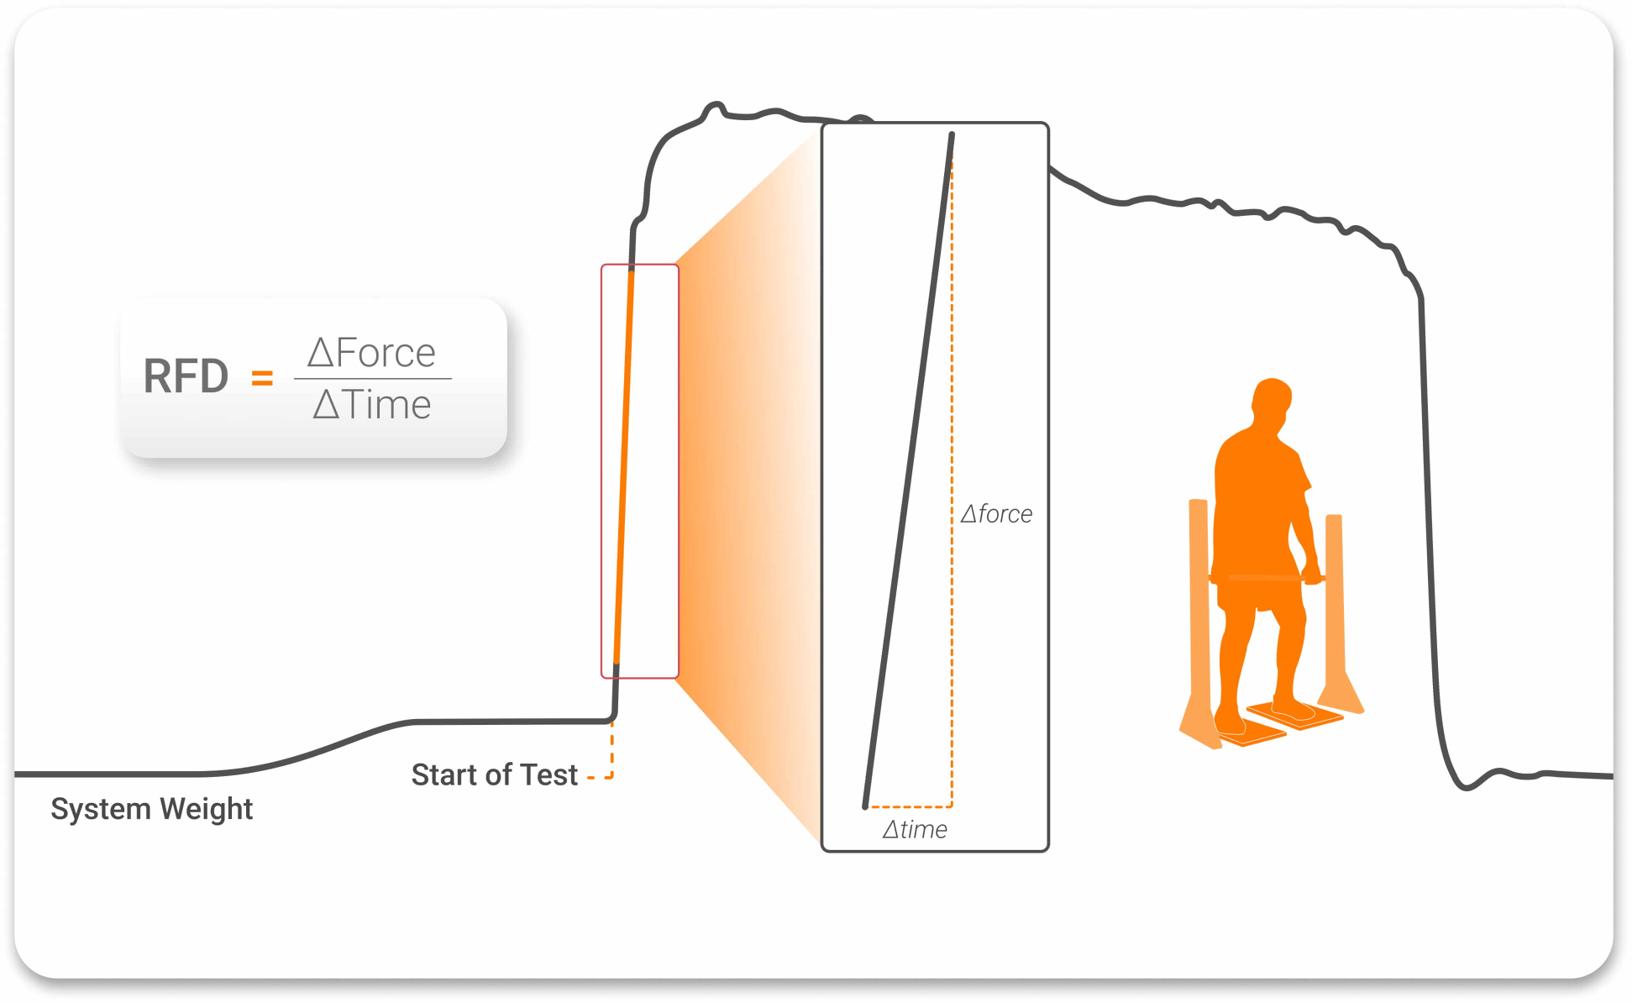
RFD and other metrics within an isometric force trace.
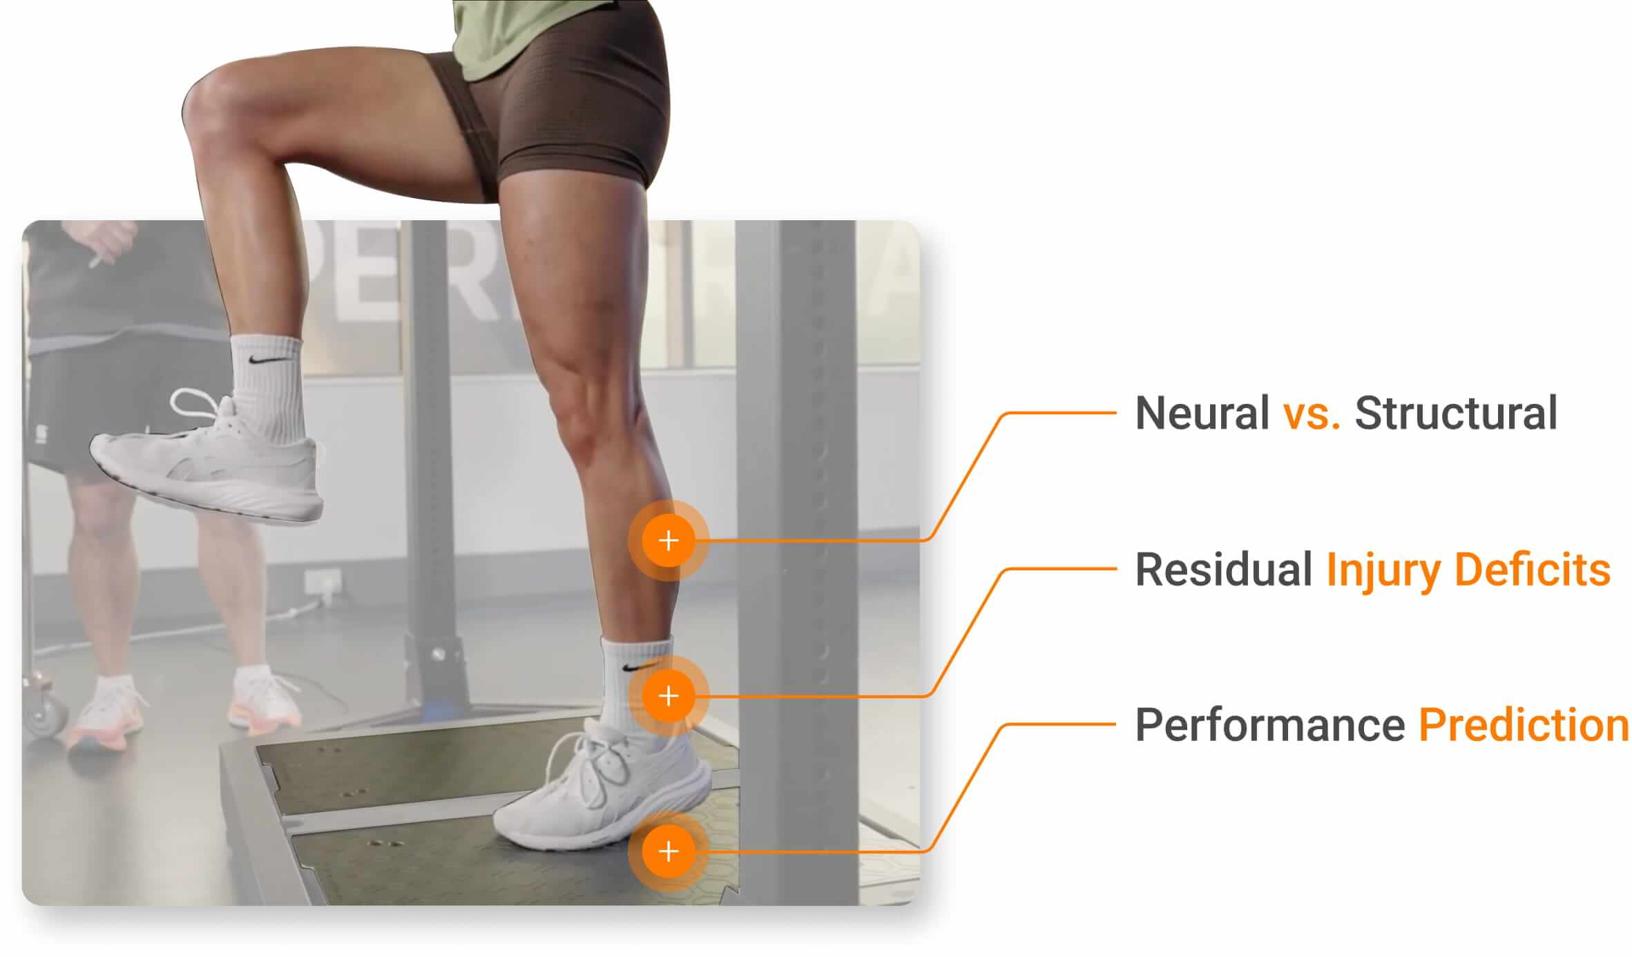
Beyond clinical scenarios, RFD assessment provides several clinical insights that peak force alone cannot:
- Identification of Neural vs. Structural Deficits: Research has demonstrated that early-phase RFD (≤150ms from time of contraction onset) primarily reflects neural drive and motor unit recruitment, while late-phase RFD (>150ms after onset) reflects both neural factors and maximal force capacity (Aagaard et al., 2002; James et al., 2023). This temporal distinction allows clinicians to differentiate between deficits in neural control and limitations in structural muscle characteristics.
- Detection of Residual Deficits Post-Injury: Patients cleared for return to sport based on strength criteria alone often display persistent RFD deficits and asymmetries that are associated with subsequent injury (Angelozzi et al., 2012; Knezevic et al., 2014).
- Functional Performance Prediction: Studies consistently demonstrate stronger correlations between RFD and functional tasks requiring rapid force application compared to peak force measures alone (Stone et al., 2004; Tillin et al., 2013). This makes RFD particularly relevant for return-to-sport and fall-risk assessment protocols.
…correlations between RFD and functional tasks requiring rapid force application [exist]…[making] RFD particularly relevant for return to sport…
RFD measurement can help clinicians better determine the tissues affected, injury-related deficits and functional performance status.
Understanding RFD
RFD can be measured during isometric, concentric and eccentric muscle actions. However, not all RFD measurements assess the same neuromuscular quality. The specific testing protocol and muscle contraction type determine which aspect of force development is being evaluated.
Isometric RFD: Early vs. Late Phase
During explosive strength assessments, such as the isometric mid-thigh pull (IMTP), clinicians can analyze RFD at different time windows:
- Early-Phase RFD (0-150ms): Predominantly reflects neural drive and motor unit recruitment speed, making it particularly sensitive to neuromuscular deficits following injury.
- Late-Phase RFD (>150ms): Incorporates both neural factors and maximal force capacity, as later time windows share greater levels of variance with peak force values.
For a more in-depth discussion of explosive strength assessment, read Lachlan James’ article on Explosive Strength.

Dynamic RFD: Movement-Specific Qualities
Dynamic movement assessments, such as those performed on ForceDecks, can help clinicians identify contraction-type-specific RFD characteristics. By separating eccentric RFD (e.g., eccentric deceleration RFD) and concentric RFD, practitioners can measure distinct physiological constructs:
- Eccentric RFD: Captures how quickly force is developed to decelerate or absorb load during countermovement jump (CMJ) descent or various drop landings (e.g., land and hold or drop jump). It reflects braking and landing control, with evidence linking eccentric RFD to jump performance and distinct neuromuscular qualities (Laffaye & Wagner, 2013; Martinopoulou et al., 2022).
- Concentric RFD: Captures how quickly force is developed during active muscle shortening, measured in the upward phase of jumping or squatting. It helps determine explosive power output, a key determinant in speed and jumping performance. Concentric RFD should be assessed using tasks that isolate upward movement, such as the squat jump (SJ), as concentric RFD is often recorded as zero during CMJs and rebound jump activities.
By separating eccentric RFD and concentric RFD, practitioners can measure distinct physiological constructs…
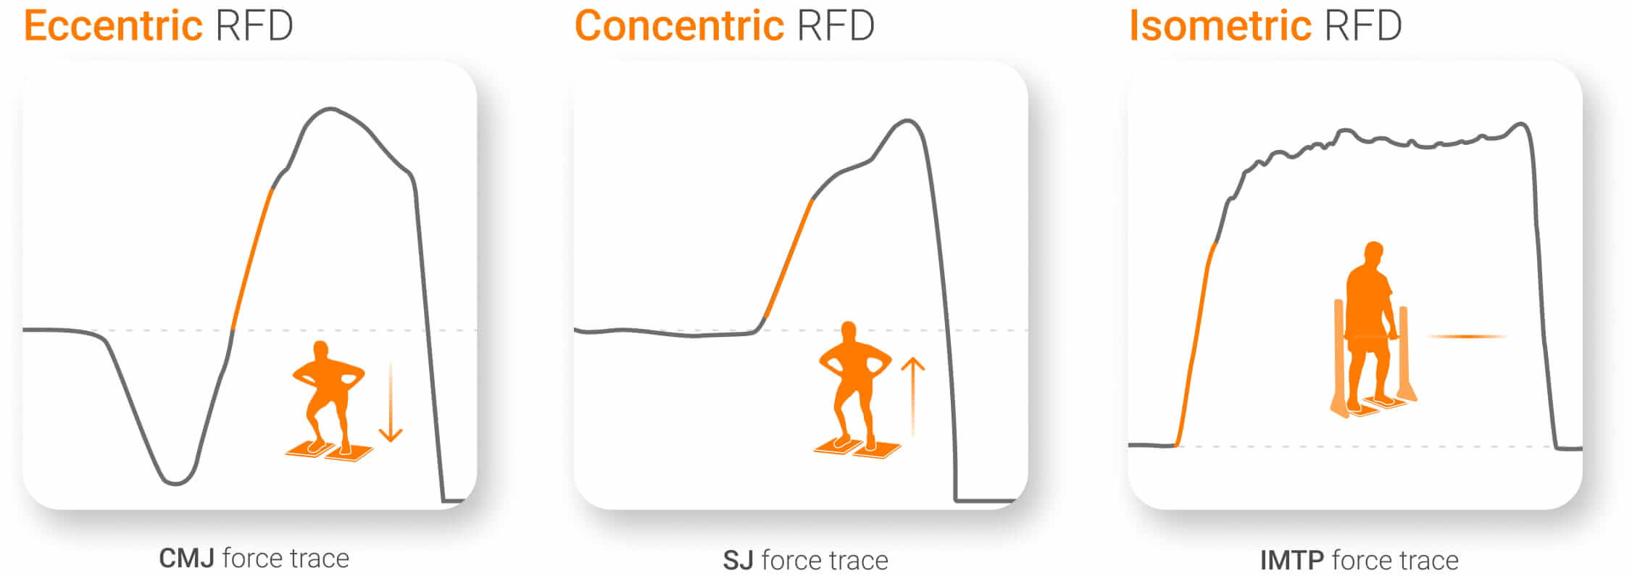
Different forms and contraction types associated with RFD.
Single-Joint RFD: Task-Specific Assessment
Technologies such as ForceFrame, NordBord and DynaMo Max can measure RFD during constrained isometric testing. Each system offers distinct assessment options for measuring RFD, with all protocols and testing options available in VALD’s Knowledge Base.
- ForceFrame: Designed for high repeatability, with preset frame heights and crossbar rotation positions allowing standardized joint angles and reproducible RFD assessment across rehabilitation time points.
- NordBord: Specialized for hamstring assessment, with updated software enabling RFD calculation during isometric testing to quantify the hamstrings’ ability to rapidly develop force at key joint angles.
- DynaMo Max: Designed to be modular and versatile, enabling clinicians to assess RFD in patient-specific positions that better reflect the patient’s anatomy, symptoms and task demands.
When aligned with the patient’s functional demands, these task-specific RFD assessments provide clinically relevant information about patient status.
When aligned with the patient’s functional demands, these task-specific RFD assessments provide clinically relevant information about patient status.
Note: During isometric assessments, applying consistent pretension for 2-3s before the assessment to remove slack in the system is critical for capturing valid RFD. Some systems, such as DynaMo Max, have in-built pretension indicators to ensure reliability during assessment.
Measurement Considerations for Reliable Data
Research comparing RFD measurement methods in isometric testing found that time-interval sampling windows (e.g., 0-100ms and 0-200ms) demonstrated high reliability across different sampling frequencies, with 500Hz being sufficient for accurate peak force and RFD measurement (Haff et al., 2015).
While laboratory research has recommended sampling rates of 1,000Hz when measuring force at the motor unit level (Maffiuletti et al., 2016), practical applications in clinical settings achieve reliable RFD measurements at much lower frequencies.
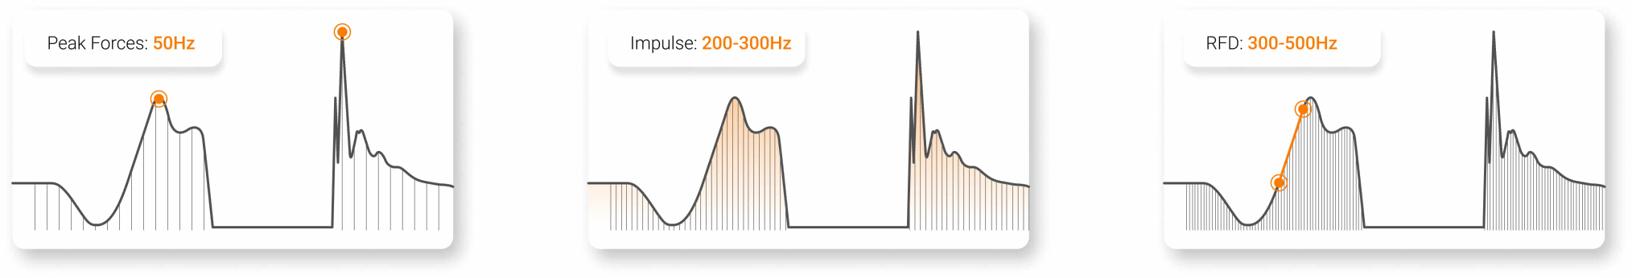
Sampling frequencies recommended for various metrics.
The minimum sampling rate depends on the specific test and metric being analyzed. For example, in most isometric and dynamic assessments, a rate of 300-500Hz is sufficient to accurately capture peak force and RFD (Renner et al., 2022).
…in most isometric and dynamic assessments, a rate of 300-500Hz is sufficient to accurately capture peak force and RFD.
For an in-depth discussion of how data capture influences these measures, read this article on Sampling Frequency.
Measurement systems such as ForceDecks, ForceFrame, NordBord and DynaMo Max sample at frequencies sufficient for accurate RFD measurement across hundreds of assessments, giving practitioners confidence in the technologies’ ability to deliver reliable, high-quality data:
- ForceDecks: 1,000Hz
- ForceFrame: 400Hz
- NordBord: 400Hz
- DynaMo Max: 1,200Hz
Because all measures of explosive strength are highly sensitive to testing setup and instruction, consistency is essential. This includes using clear, repeatable cues, fixed-joint angles and consistent patient status (e.g., fatigued or fresh) to help reduce noise and improve interpretability.
Clinical Applications Across Populations
RFD deficits commonly persist beyond the resolution of strength deficits and are closely linked to ongoing limitations in tasks that require rapid force application. Objective testing helps differentiate which qualities still require development and can guide more precise rehabilitation progressions.
RFD deficits commonly persist beyond the resolution of strength deficits and are closely linked to ongoing limitations in tasks that require rapid force application.
In knee rehabilitation, fixed-frame dynamometry (e.g., ForceFrame) can quantify isometric knee extension RFD to support progression from basic strength toward explosive and reactive training. Evidence following anterior cruciate ligament reconstruction (ACLR) shows that patients cleared on strength alone often retain time-constrained force asymmetries (Knezevic et al., 2014), which have been linked to reduced performance and increased risk of secondary injury (Paterno et al., 2010; Kyritsis et al., 2016).
Force plate assessments can extend these insights by quantifying concentric and eccentric RFD during CMJ, drop jump and single leg jump tests, supporting return-to-sport decisions beyond traditional peak force benchmarks.
In older adults, rapid force production is a key determinant of balance recovery and fall risk. Force plates, such as ForceDecks, can quantify RFD during sit-to-stand tasks to inform objective fall-risk and recovery stratification (Robinovitch et al., 2002; Kamo et al., 2019).
Practical Implementation
RFD assessment provides information about neuromuscular function that peak force measurement alone cannot capture. The ability to rapidly develop force directly impacts functional performance across populations, from fall risk in older adults to return-to-sport readiness in athletes.
By incorporating RFD assessments and training into rehabilitation protocols, clinicians can identify residual deficits, guide intervention selection and make safer, more informed decisions about functional readiness.
If you are looking to apply RFD assessment more confidently in rehabilitation and learn more about the range of RFD-enabled technologies that VALD provides, contact us today.
References
- Tillin, N. A., Pain, M. T., & Folland, J. (2013). Explosive force production during isometric squats correlates with athletic performance in rugby union players. Journal of Sports Sciences, 31(1), 66–76. https://doi.org/10.1080/02640414.2012.720704
- Aagaard, P., Simonsen, E. B., Andersen, J. L., Magnusson, P., & Dyhre-Poulsen, P. (2002). Increased rate of force development and neural drive of human skeletal muscle following resistance training. Journal of Applied Physiology, 93(4), 1318–1326. https://doi.org/10.1152/japplphysiol.00283.2002
- Bento, P. C. B., Pereira, G., Ugrinowitsch, C., & Rodacki, A. L. F. (2010). Peak torque and rate of torque development in elderly with and without fall history. Clinical Biomechanics, 25(5), 450–454. https://doi.org/10.1016/j.clinbiomech.2010.02.002
- James, L. P., Talpey, S. W., Young, W. B., Geneau, M. C., Newton, R. U., & Gastin, P. B. (2023). Strength classification and diagnosis: Not all strength is created equal. Strength and Conditioning Journal, 45(3), 333–341. https://doi.org/10.1519/ssc.0000000000000744
- Angelozzi, M., Madama, M., Corsica, C., Calvisi, V., Properzi, G., McCaw, S. T., & Cacchio, A. (2012). Rate of force development as an adjunctive outcome measure for return-to-sport decisions after anterior cruciate ligament reconstruction. Journal of Orthopaedic & Sports Physical Therapy, 42(9), 772–780. https://doi.org/10.2519/jospt.2012.3780
- Knezevic, O. M., Mirkov, D. M., Kadija, M., Nedeljkovic, A., & Jaric, S. (2014). Asymmetries in explosive strength following anterior cruciate ligament reconstruction. The Knee, 21(6), 1039–1045. https://doi.org/10.1016/j.knee.2014.07.021
- Stone, M. H., Sands, W. A., Carlock, J., Callan, S., Dickie, D., Daigle, K., Cotton, J., Smith, S. L., & Hartman, M. (2004). The importance of isometric maximum strength and peak rate-of-force development in sprint cycling. Journal of Strength and Conditioning Research, 18(4), 878–884. https://doi.org/10.1519/14874.1
- Laffaye, G., & Wagner, P. (2013). Eccentric rate of force development determines jumping performance. Computer Methods in Biomechanics and Biomedical Engineering, 16(sup1), 82–83. https://doi.org/10.1080/10255842.2013.815839
- Martinopoulou, K., Donti, O., Sands, W. A., Terzis, G., & Bogdanis, G. C. (2022). Evaluation of the isometric and dynamic rates of force development in multi-joint muscle actions. Journal of Human Kinetics, 81, 135–148. https://doi.org/10.2478/hukin-2021-0130
- Haff, G. G., Ruben, R. P., Lider, J., Twine, C., & Cormie, P. (2015). A comparison of methods for determining the rate of force development during isometric midthigh clean pulls. Journal of Strength and Conditioning Research, 29(2), 386–395. https://doi.org/10.1519/jsc.0000000000000705
- Maffiuletti, N. A., Aagaard, P., Blazevich, A. J., Folland, J., Tillin, N., & Duchateau, J. (2016). Rate of force development: Physiological and methodological considerations. European Journal of Applied Physiology, 116(6), 1091–1116. https://doi.org/10.1007/s00421-016-3346-6
- Renner, K. E., Peebles, A. T., Socha, J. J., & Queen, R. M. (2022). The impact of sampling frequency on ground reaction force variables. Journal of Biomechanics, 135, 111034. https://doi.org/10.1016/j.jbiomech.2022.111034
- Paterno, M. V., Schmitt, L. C., Ford, K. R., Rauh, M. J., Myer, G. D., Huang, B., & Hewett, T. E. (2010). Biomechanical measures during landing and postural stability predict second anterior cruciate ligament injury after anterior cruciate ligament reconstruction and return to sport. The American Journal of Sports Medicine, 38(10), 1968–1978. https://doi.org/10.1177/0363546510376053
- Kyritsis, P., Bahr, R., Landreau, P., Miladi, R., & Witvrouw, E. (2016). Likelihood of ACL graft rupture: Not meeting six clinical discharge criteria before return to sport is associated with a four times greater risk of rupture. British Journal of Sports Medicine, 50(15), 946–951. https://doi.org/10.1136/bjsports-2015-095908
- Robinovitch, S. N., Heller, B., Lui, A., & Cortez, J. (2002). Effect of strength and speed of torque development on balance recovery with the ankle strategy. Journal of Neurophysiology, 88(2), 613–620. https://doi.org/10.1152/jn.2002.88.2.613
- Kamo, T., Asahi, R., Azami, M., Ogihara, H., Ikeda, T., Suzuki, K., & Nishida, Y. (2019). Rate of torque development and the risk of falls among community dwelling older adults in Japan. Gait & Posture, 72, 28–33. https://doi.org/10.1016/j.gaitpost.2019.05.019