Understanding Jump Testing in HumanTrak
Available in:
EN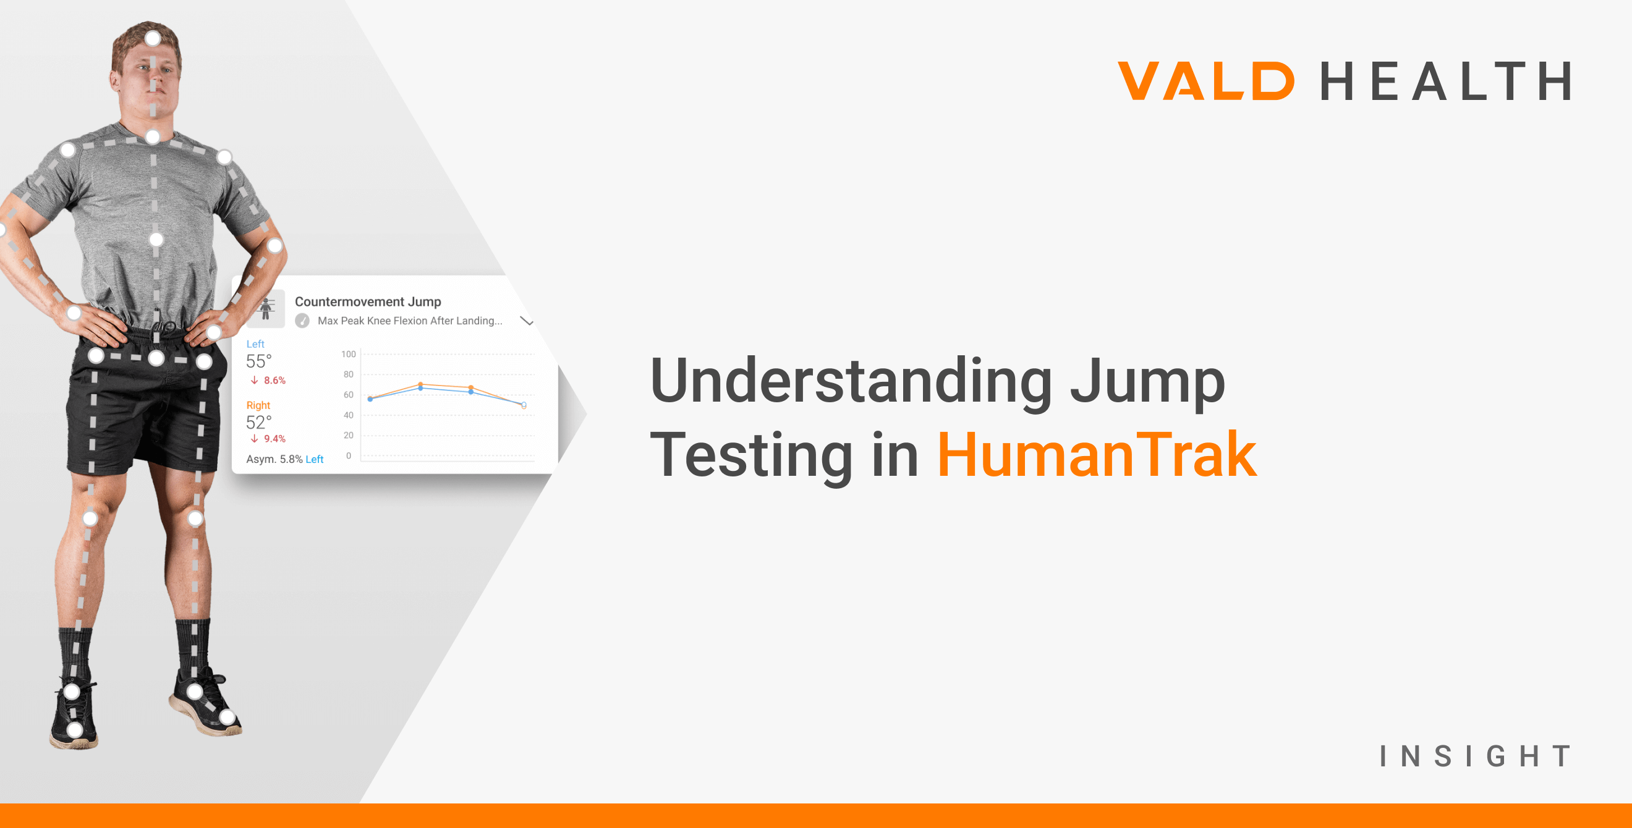
In addition to objective jump height measurement, jump testing with HumanTrak provides a complete biomechanical picture of how the movement is performed, from takeoff to landing.
…jump testing with HumanTrak provides a complete biomechanical picture of how the movement is performed, from takeoff to landing.
A quick look at the countermovement jump (CMJ) performed using HumanTrak.
Traditionally, tools like Vertec and jump mats have been used to measure CMJ performance by providing a quick estimate of jump height.
Force plates build on this by capturing kinetic data, which is information about the forces that generate movement. These include variables such as peak and average forces, impulse, rate of force development (RFD) and peak landing force asymmetry, helping practitioners understand not just how high someone jumps but also how they generate and attenuate force.
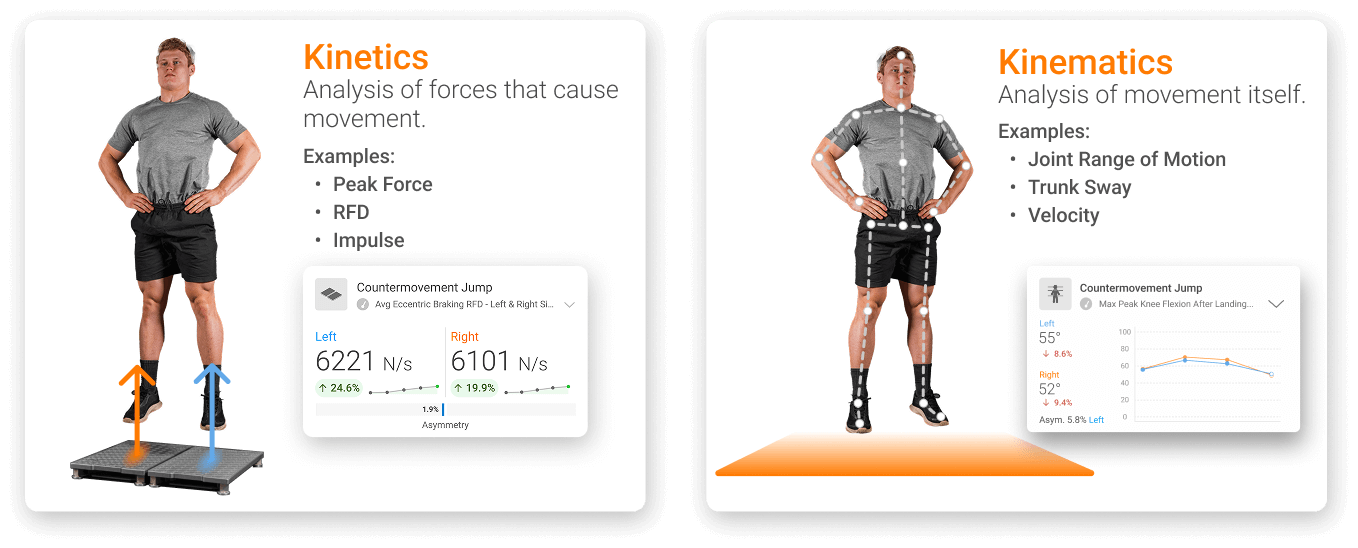
Definition and examples of kinetics and kinematics.
Now, HumanTrak makes it easy to measure kinematics – the subsequent movements created by forces. By capturing joint angles and changes in body positions over time, HumanTrak provides a clearer picture of how someone moves, revealing compensatory strategies employed to maintain kinetic output.
While jump height remains a widely used outcome in CMJ testing, kinematic analysis provides critical insight into movement strategy. HumanTrak captures joint angles and segment positions throughout the jump, allowing for a detailed biomechanical assessment that goes well beyond how high a patient jumps.
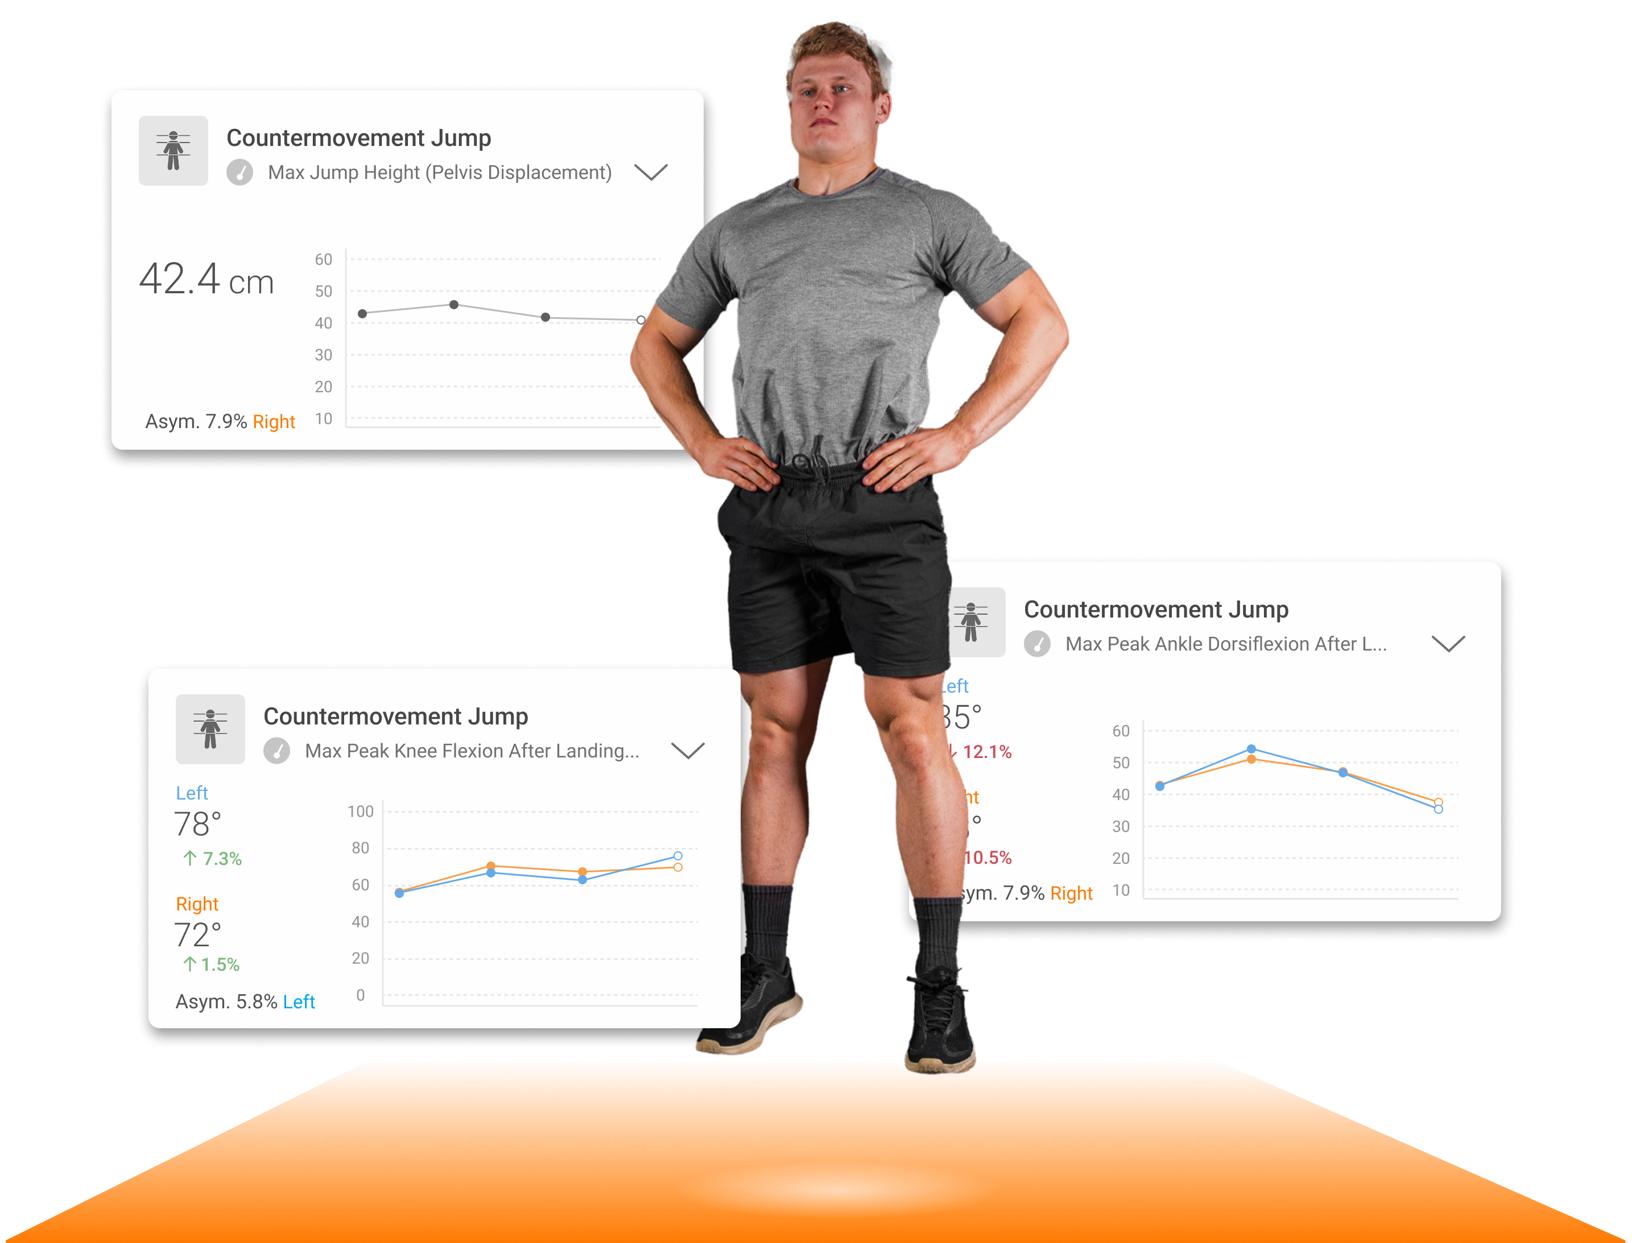
Joint angles and jump height data from a CMJ captured in HumanTrak and displayed in VALD Hub.
What HumanTrak Measures During the CMJ
HumanTrak captures the following kinematic variables and key moments during the CMJ to support movement analysis and interpretation:
Movement Coordination During the Jump
During the initial countermovement phase, HumanTrak measures variables such as knee, hip, ankle and trunk flexion, offering valuable insight into a patient’s neuromuscular control, movement asymmetry and load distribution.
…HumanTrak measures…knee, hip, ankle and trunk flexion, offering valuable insight into a patient’s neuromuscular control, movement asymmetry and load distribution.
For example, a shallow countermovement depth can indicate suboptimal use of the stretch-shortening cycle, whereas excessive frontal plane motion – such as dynamic knee valgus or trunk lateral flexion – may suggest deficits in coordination and control.
HumanTrak also tracks center of mass (CoM) lateral displacement, enhancing interpretation by quantifying mediolateral balance throughout the jump.
Landing Strategy and Stability
Following landing, HumanTrak captures key joint angles at peak flexion across the hip, knee and ankle, along with previously mentioned metrics such as trunk lateral flexion and dynamic knee valgus.
These metrics are essential for evaluating a patient’s ability to attenuate force and stabilize effectively upon ground contact. Stiff or asymmetrical landings – which are often subtle and difficult to detect visually – can now be identified objectively and tracked over time to monitor return-to-sport readiness.
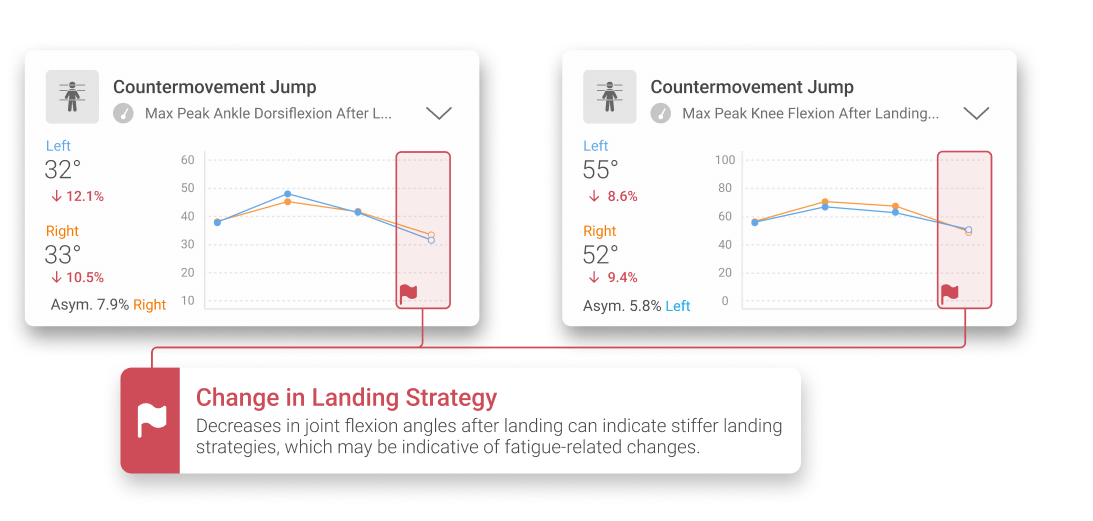
Longitudinal tracking of joint flexion after landing allows landing strategy to be monitored over time and subtle changes to be identified.
Visual Snapshots for Added Context
HumanTrak also provides feedback by automatically capturing key metrics and snapshots at important moments during the CMJ, including:
- Peak countermovement depth
- Peak knee flexion after landing
- Peak hip flexion after landing
- Peak jump height
These snapshots provide immediate visual context to support practitioner interpretation and patient education. Presenting movement visually reinforces understanding, improves communication and increases buy-in with performance or rehabilitation goals.
Presenting movement visually reinforces understanding, improves communication and increases buy-in…
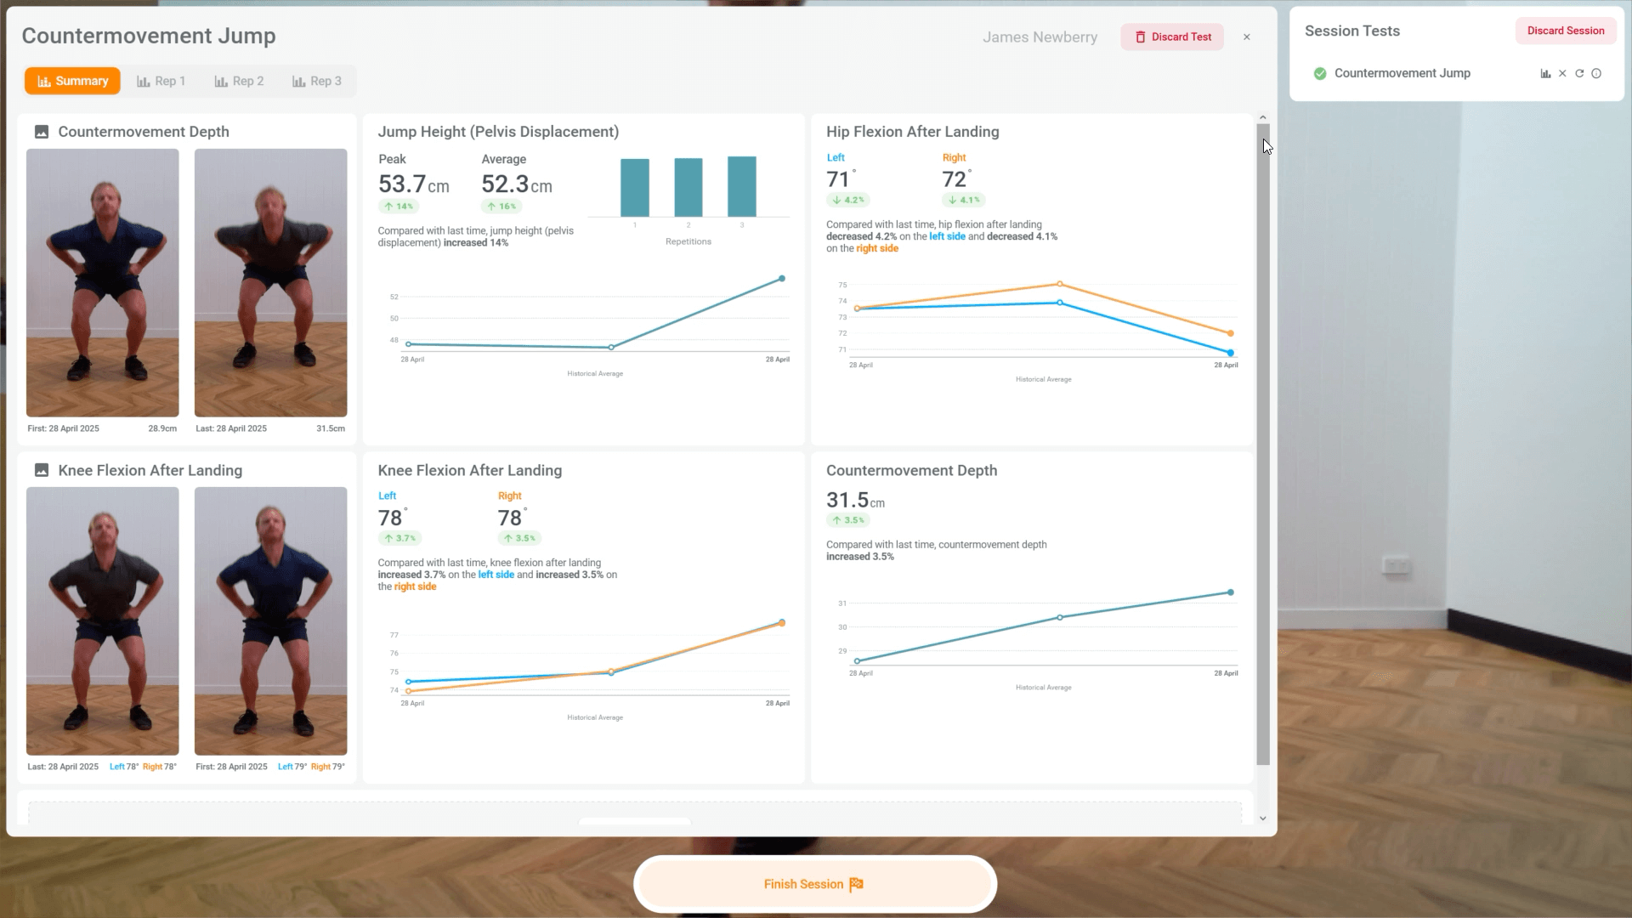
In-app CMJ test results with key snapshots and longitudinal data tracking to monitor progress over time.
Together, these kinematic variables and key moments enable a comprehensive analysis that elevates the CMJ from a performance test to a detailed movement assessment. Practitioners gain insight into not only how high a patient jumps, but the strategy the patient uses to achieve their jump height. This makes HumanTrak an ideal tool for live joint tracking during jumps, longitudinal progress monitoring and confident return-to-sport decision-making.
Building on the movement data captured by HumanTrak during the CMJ, it is also important to understand how jump height is calculated. HumanTrak uses a different method than force plate systems such as ForceDecks, and understanding this distinction is essential for accurate result interpretation.
Benefits of Kinematic and Kinetic Analysis of Jumps
When assessing jumps, using both kinetic analysis from ForceDecks and kinematic analysis from HumanTrak systems can provide a powerful, complementary view of performance and injury risk. Force plates quantify the magnitude and timing of force production, capturing metrics such as peak force, RFD and impulse.
…using both kinetic analysis from ForceDecks and kinematic analysis from HumanTrak systems can provide a powerful, complementary view of performance and injury risk.
These are all critical indicators of neuromuscular output and are especially useful for evaluating eccentric control, concentric power production and side-to-side asymmetries in ground reaction force. However, force data alone can sometimes mask movement compensations, particularly if a patient is producing similar force magnitudes but moving differently on each side.
In comparison, HumanTrak’s kinematic analysis captures how the movement is performed, helping clinicians and coaches understand whether an asymmetry is driven by compensatory movement patterns or poor postural control.
For example, kinetics from force plates can reveal a peak landing force asymmetry, and kinematics from motion analysis can reveal the underlying cause, such as excessive trunk lateral flexion to one side. Poor frontal plane control such as this may go undetected without HumanTrak. ForceDecks tells you how much load is applied through each limb, while HumanTrak shows how the entire body moves to generate and absorb force during jumps.
HumanTrak vs. ForceDecks Jump Height Calculations
While both HumanTrak and ForceDecks can measure jump height in the CMJ, they do so in fundamentally different ways, meaning their values are not directly interchangeable. ForceDecks calculates jump height using three methods:
- Flight Time (based on how long the patient is airborne)
- Impulse-Momentum (based on takeoff velocity from force data)
- Impulse-Displacement (based on max displacement of CoM from force data)
HumanTrak, on the other hand, uses 3D motion capture to measure the change in vertical displacement of the pelvis markers from a standing position to the peak of the jump.
Jump height differs between HumanTrak (left) and ForceDecks (right) because each system calculates height from a different reference point during the jump.
Why Do HumanTrak Jump Heights Appear Higher?
The difference in how jump height is measured – from standing in HumanTrak versus from takeoff in ForceDecks – explains why the two systems report different values, as the underlying calculations are not the same. HumanTrak includes the vertical rise that occurs before the feet leave the ground (known as takeoff displacement), while ForceDecks measures from the point of takeoff to landing.
The difference in how jump height is measured – from standing in HumanTrak versus from takeoff in ForceDecks – explains why the two systems report different values…
Takeoff displacement (d) calculated as the displacement from standing to the moment of takeoff.
VALD’s internal data showed an average difference of approximately 10cm between systems. When accounting for takeoff displacement – defined as the rise that happens before the feet leave the ground, such as pushing up onto the toes – the gap reduces to approximately 1cm.
VALD’s internal data showed an average difference of approximately 10cm between systems. When accounting for takeoff displacement…the gap reduces to approximately 1cm.
Regression models have been created to convert HumanTrak values into ForceDecks-equivalent jump heights, explaining over 94% of the variance. These can support interpretation across systems when needed. However, if your goal is simply to track change over time, either system is effective and neither should be considered more or less “accurate” than the other. What matters most is – whichever method you choose – applying it consistently.
While HumanTrak jump height is valid and reliable, it should not be directly compared to ForceDecks without accounting for takeoff displacement or using the available conversion equations.
That is why, beyond understanding how jump height is calculated, it is equally important to know how accurate and reliable those values are, especially when using them to guide clinical or performance decision-making.
Jump Height Data You Can Trust
Based on an internal study, HumanTrak jump height has been shown to be:
- Accurate – within 2.7cm of the gold-standard Vicon motion capture system
- Reliable – with a test-retest intraclass correlation coefficient (ICC) of 0.96 in lab settings and 0.97 in clinical settings
- Sensitive to Change – with a minimal detectable change (MDC) of 2.2cm in lab settings and 4.4 cm in clinical settings
…HumanTrak jump height has been shown to be accurate within 2.7cm of [Vicon]… reliable with a test-retest ICC of 0.97… [and] sensitive to change with an MDC of 2.2cm…
In addition to jump height, other key kinematic metrics captured during the CMJ and single-leg CMJ with HumanTrak have also been validated for accuracy and reliability (Collings et al., 2024).
ForceDecks are also highly accurate, with force measurements validated against gold-standard force plates and excellent test-retest reliability for both flight time and impulse-momentum methods.
For side-by-side reference, the table below outlines ICC and MDC values by system and environment:
| Method | ICC (Lab) | ICC (Clinic) | MDC (Lab) | MDC (Clinic) |
|---|---|---|---|---|
| HumanTrak | 0.96 | 0.97 | 2.2cm | 4.4cm |
| ForceDecks Flight Time | 0.97 | 0.97 | 3.6cm | 4.1cm |
| ForceDecks Impulse-Momentum | 0.97 | 0.97 | 3.4cm | 3.5cm |
The 2.2cm MDC difference observed in HumanTrak’s clinical setting (compared to the lab) is expected due to environmental factors such as lighting, background color and clothing, which can affect marker tracking. However, the 4.4cm MDC remains well within acceptable limits and comparable to ForceDecks, particularly using the flight time calculation method (4.1cm).
Together, these results demonstrate that HumanTrak delivers reliable data across a range of settings.
Take the Next Step
By combining objective measurement with biomechanical context, HumanTrak empowers practitioners to assess quality, track changes and communicate more effectively with patients.
If you would like to learn more about jump testing in HumanTrak, have questions about calculation methods or any other queries, please reach out – we are happy to help.
References
- Collings, T. J., Devaprakash, D., Pizzolato, C., Lloyd, D. G., Barrett, R. S., Lenton, G. K., Thomeer, L. T., & Bourne, M. N. (2024). Inclusion of a skeletal model partly improves reliability of lower limb joint angles derived from a markerless depth camera. Journal of Biomechanics, 170, 112160. https://doi.org/10.1016/j.jbiomech.2024.112160
- Collings, T. J., Lima, Y. L., Dutaillis, B., & Bourne, M. N. (2024). Concurrent validity and test–retest reliability of VALD ForceDecks’ strength, balance, and movement assessment tests. Journal of Science and Medicine in Sport, 27(8), 572–580. https://doi.org/10.1016/j.jsams.2024.04.014