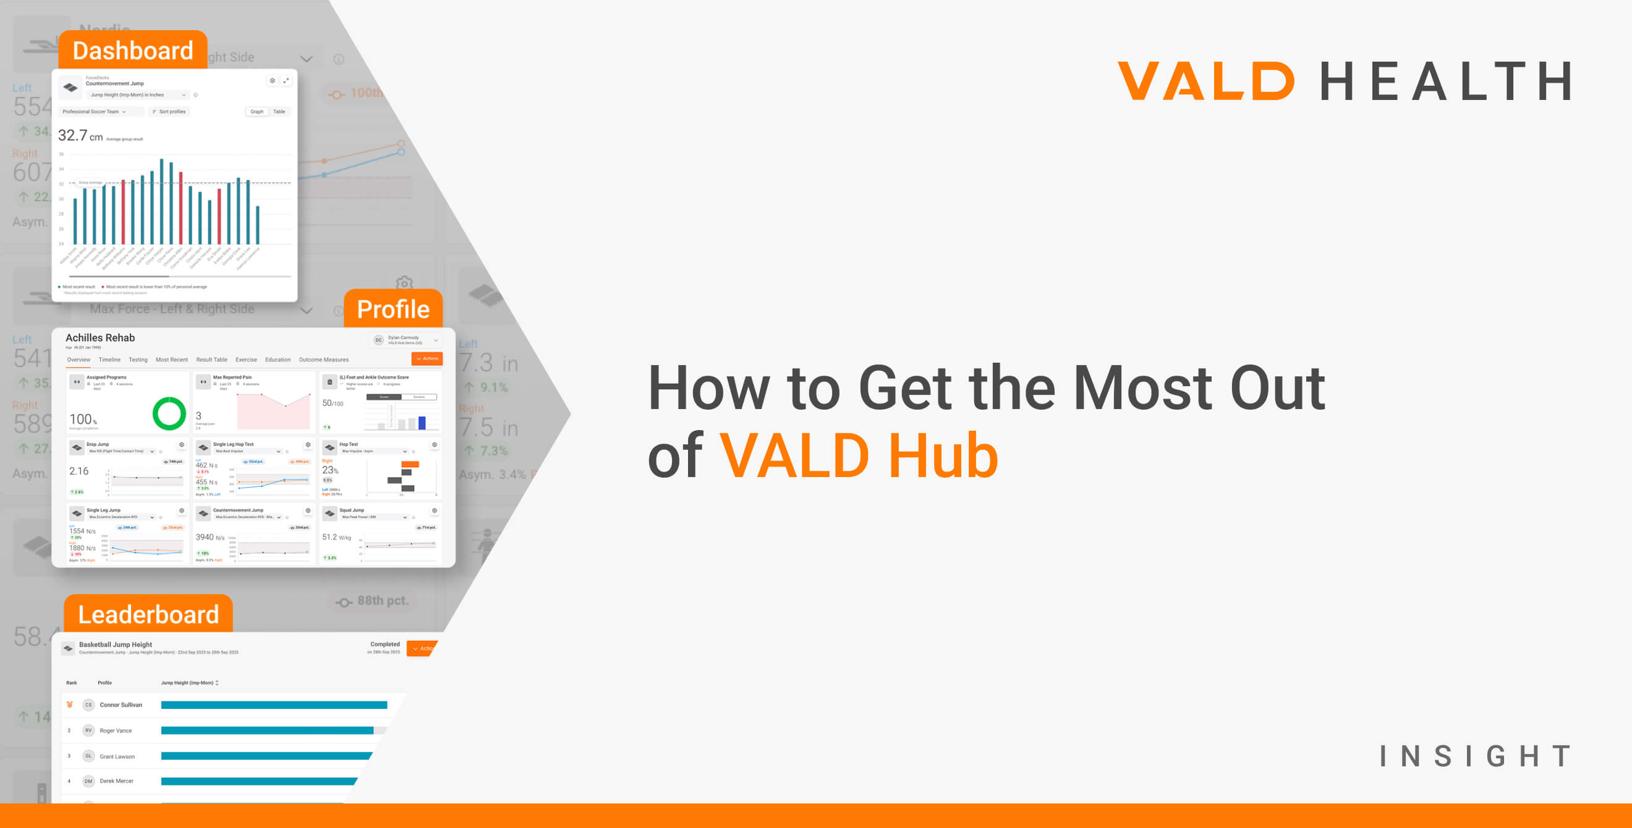
How to Get the Most Out of VALD Hub
In most healthcare settings, the barrier to objective testing is rarely a lack of knowledge about the utility of technology, but rather the inefficiencies that arise when technology is decentralized. When data collection occurs across disconnected systems, results become difficult to standardize, compare and interpret at scale, limiting the ability to build reliable reference data and monitor change over time.
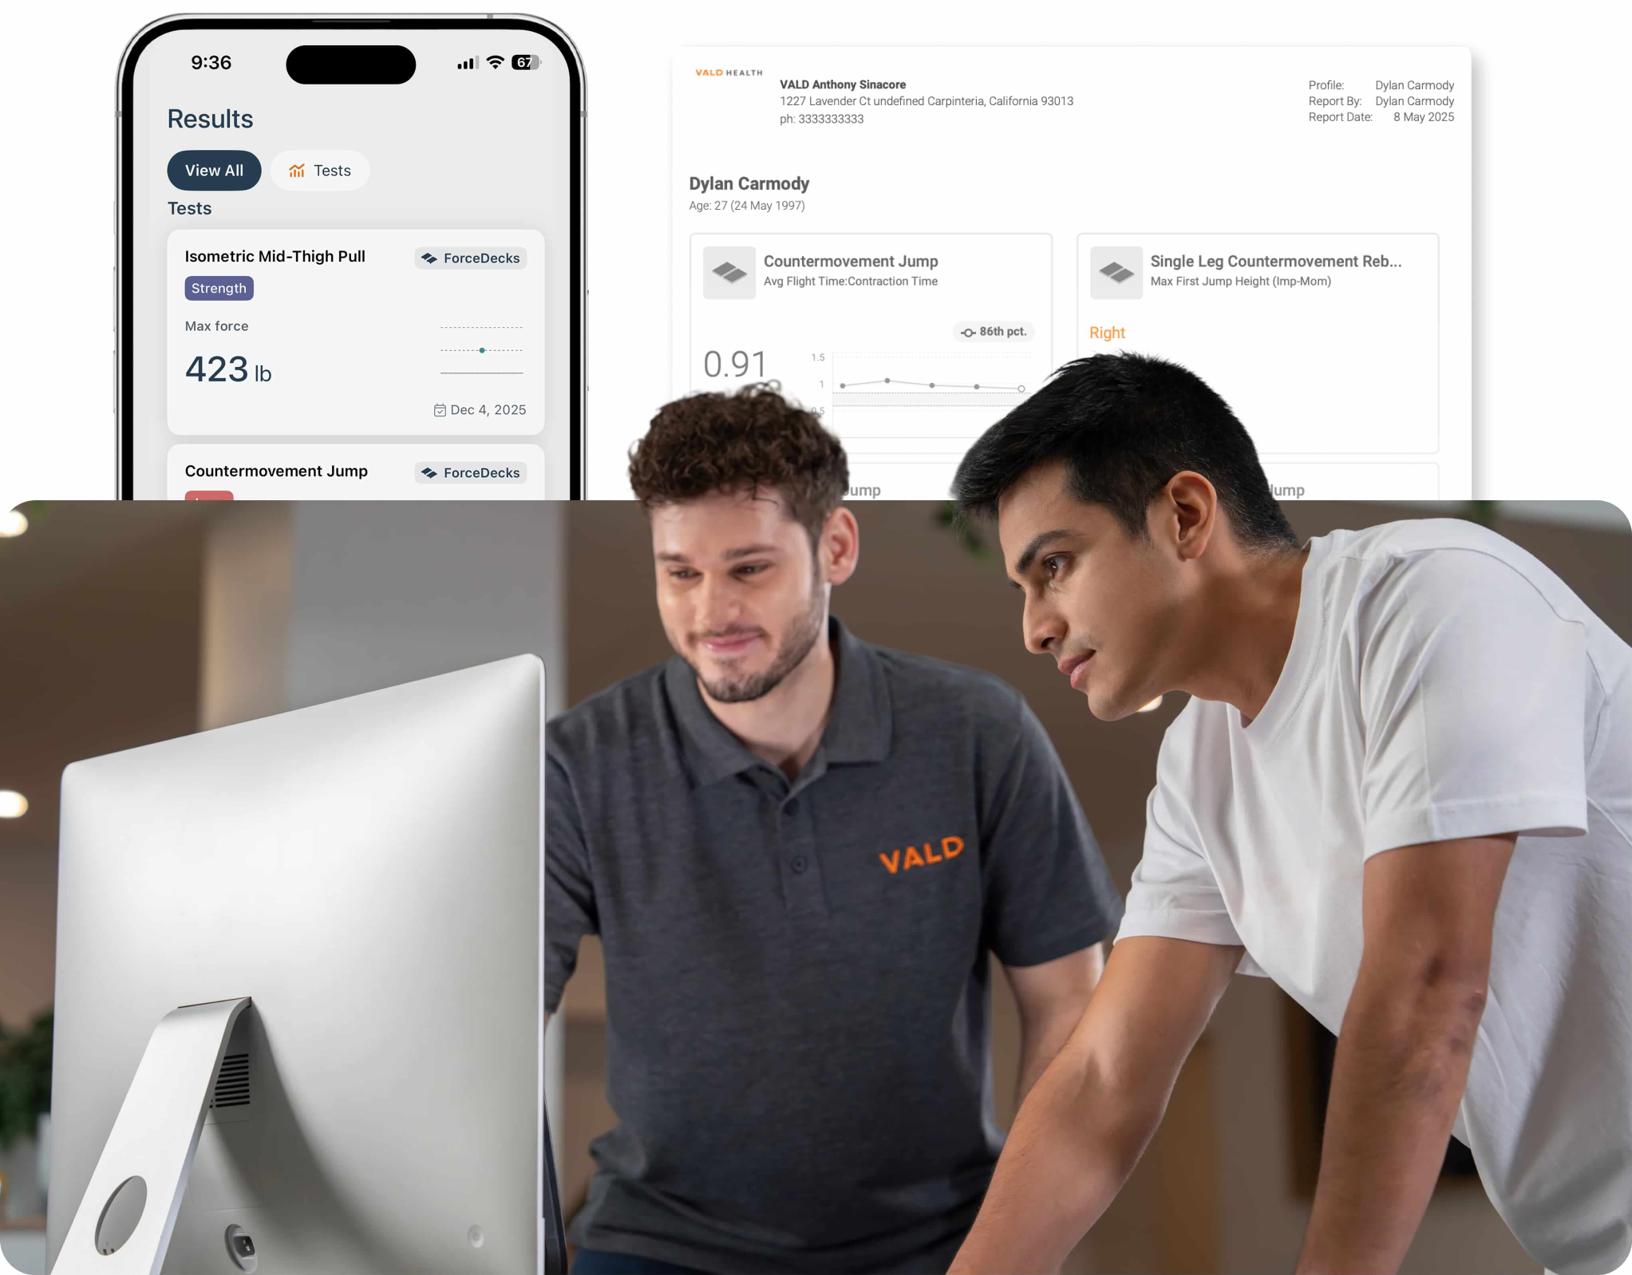
VALD Hub solves these problems. As a cloud-based platform that centralizes, visualizes and reports data collected from all VALD systems, VALD Hub allows practitioners to store, organize, analyze and share objective data, all from a single login.
[VALD Hub is] a cloud-based platform that centralizes, visualizes and reports data collected from all VALD systems…
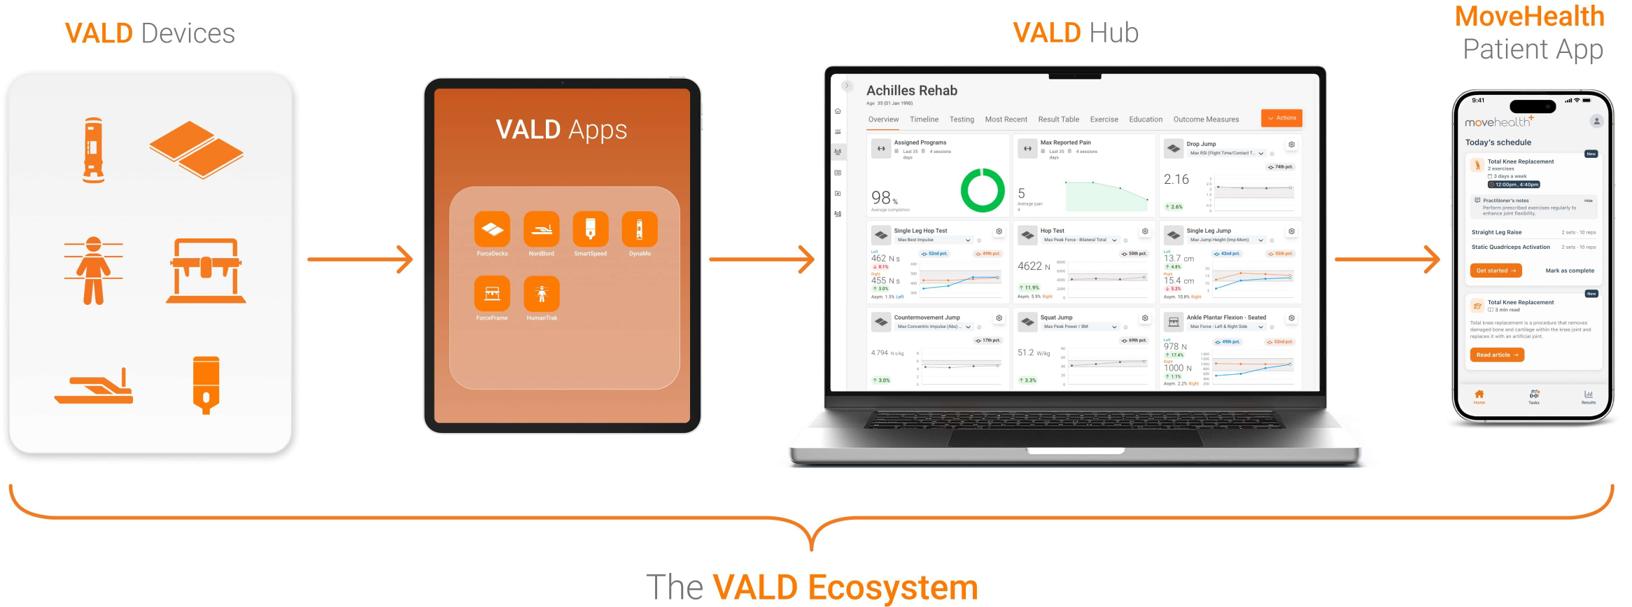
VALD Hub consolidates data across all VALD systems into a single, centralized platform.
Beyond data storage, VALD Hub provides timeline trends, custom quadrant and monitoring charts and exercise prescription capabilities, enabling practitioners to:
- Spend less time documenting and more time delivering care
- Make clearer, faster progression decisions using objective data
- Communicate performance trends confidently across interdisciplinary teams
- Increase patient buy-in through visible, measurable progress
- Standardize workflows across practitioners and sites
This article outlines practical ways practitioners can use VALD Hub’s key features and workflows to reduce admin time, improve clarity and strengthen patient engagement.
Navigating VALD Hub
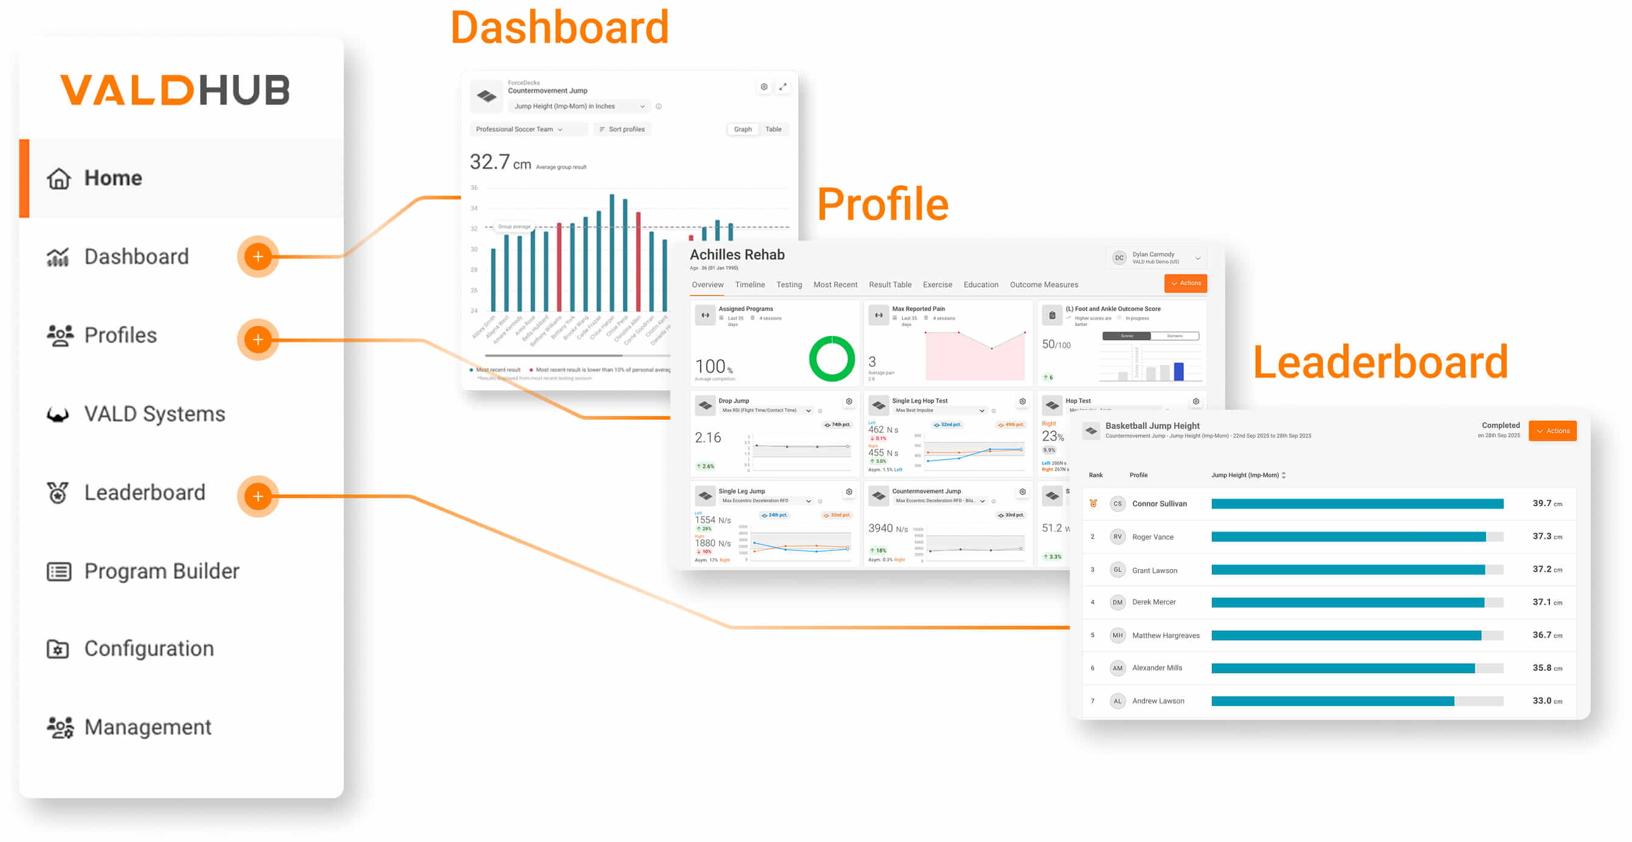
VALD Hub is specifically designed around a small number of core screens and features that allow practitioners to quickly take collected data and apply it in their practice. Once a test is completed and uploaded, data from any VALD system can be viewed at the individual profile level or organized across groups for broader analysis.
…data from any VALD system can be viewed at the individual profile level or organized across groups for broader analysis.
Profiles
Practitioners typically begin on the Profiles page, where each patient has a dedicated overview and timeline screen, showing recent tests, exercise completion rates (if using MoveHealth) and patient-reported outcome measure (PROM) scores. The overview screen can be customized to show any metric from the assessments practitioners have conducted with their patients.
From this screen, practitioners can perform a variety of functions, including:
- Review performance and individual testing graphs
- Print summary reports
- Assign outcome measures
- View session-by-session test results in the Timeline view
Dashboard and Leaderboard
For broader monitoring, the Dashboard and Leaderboard pages provide engaging reports for practitioners and patients. On the Dashboard page, practitioners can filter results by groups and tags to compare a range of assessments and qualities.
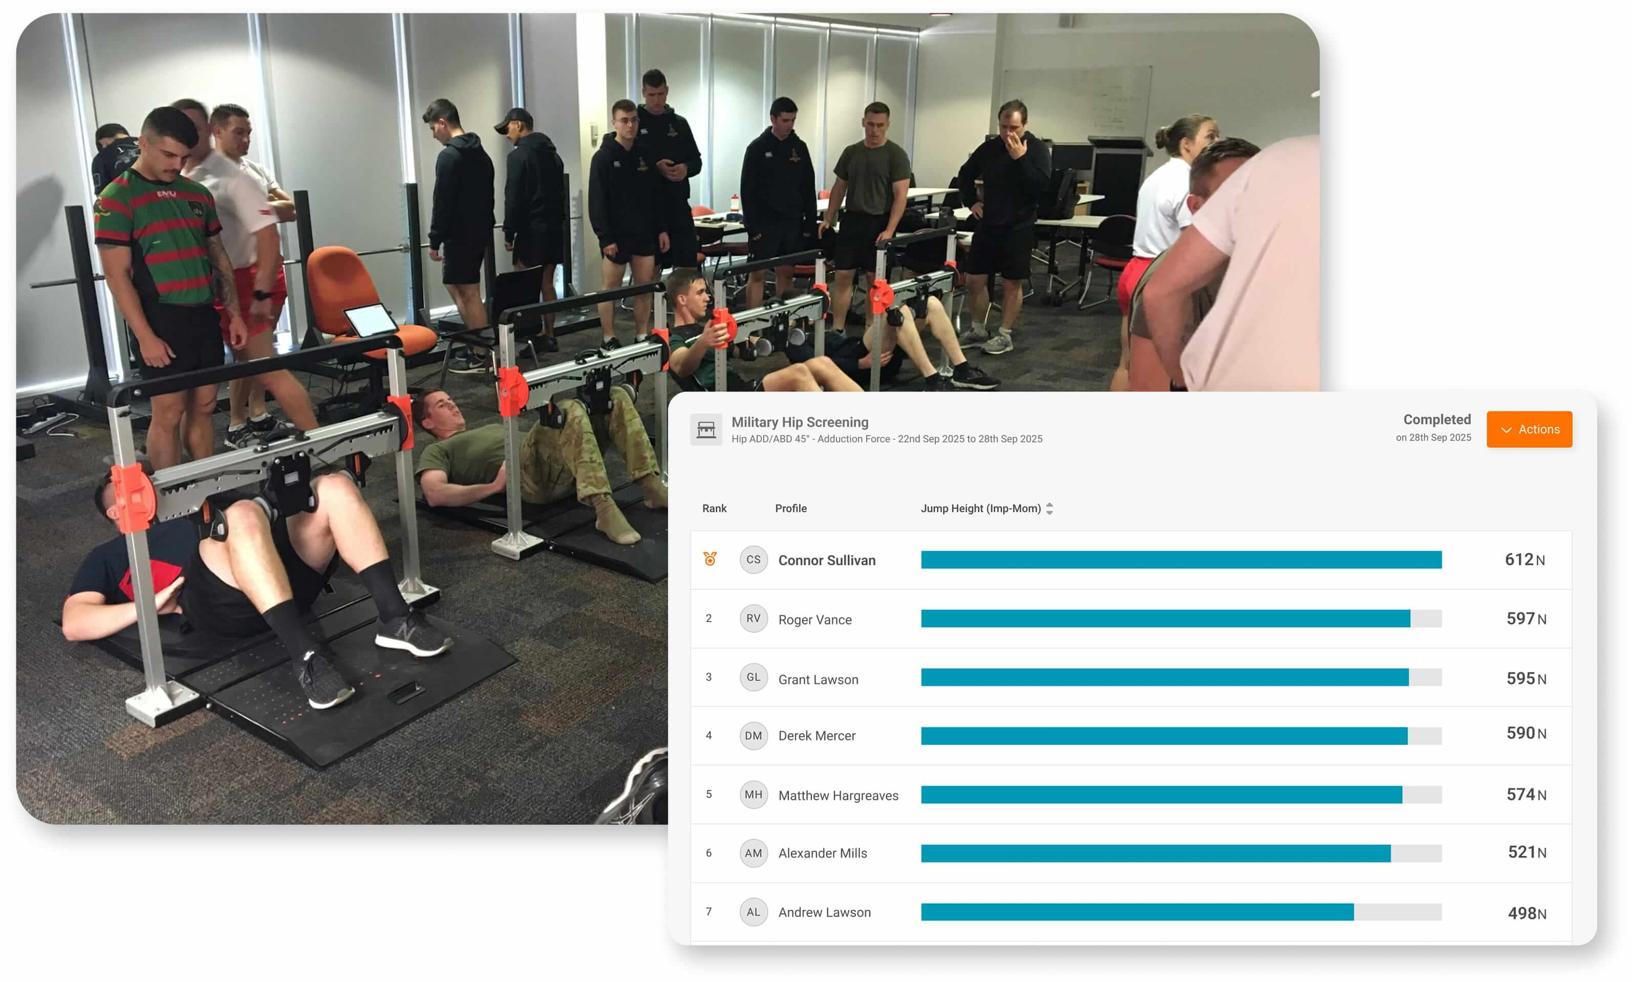
Leaderboards provide a simple way to display and compare results across groups, highlighting top performers for any selected test metric. They are particularly effective for providing live updates during testing, increasing engagement during testing sessions and creating a competitive environment that can drive effort and buy-in from patients.
Configuration and Program Builder
The Configuration and Program Builder pages provide basic management platforms for patient training programs.
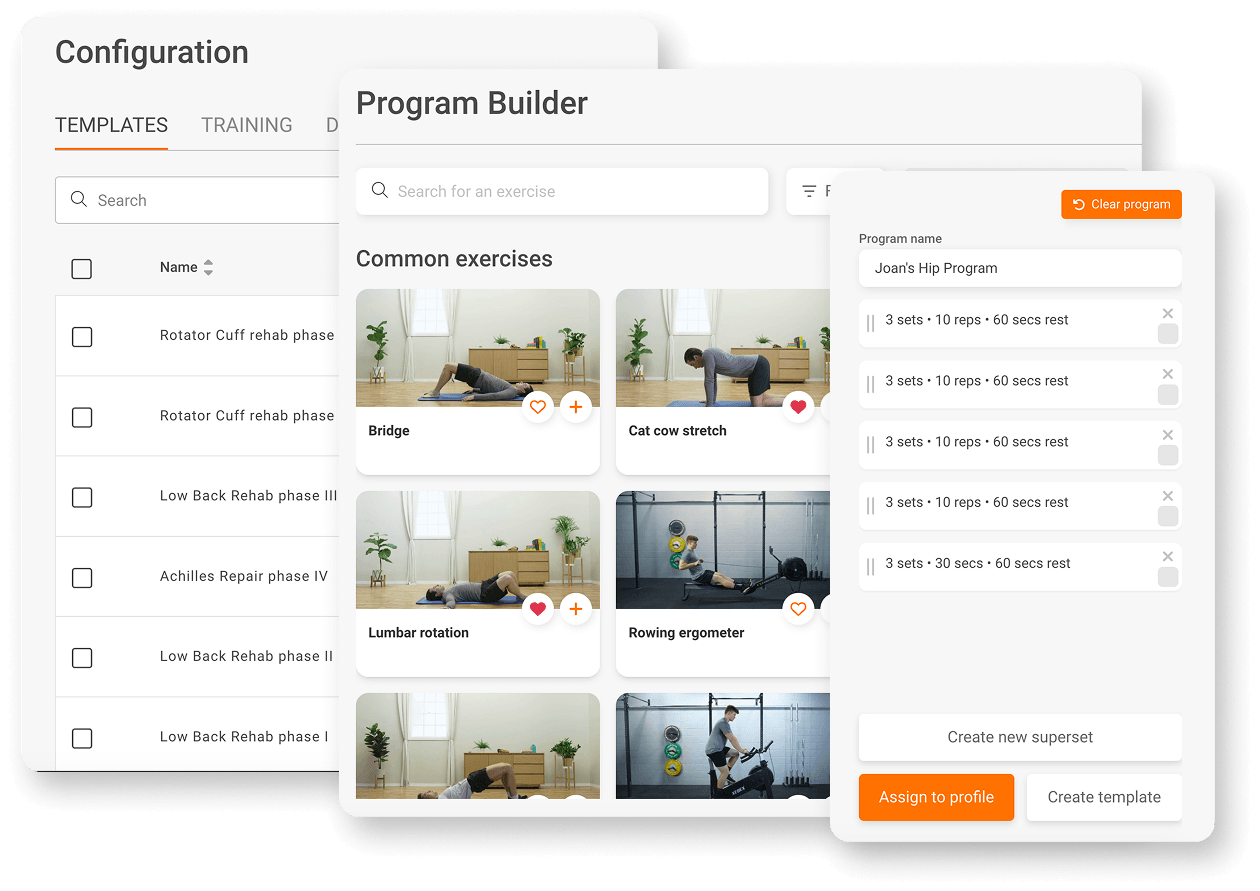
The Configuration tab allows practitioners to build Training Mode prescriptions and organize home exercise program (HEP) templates. Similarly, VALD Hub’s Program Builder enables practitioners to assign HEP templates, PROMs and education resources, and create custom HEPs from 7,000+ exercises and programming tools such as supersets and rest timing.
To learn more about how to navigate VALD Hub, check out our free VALD Academy course.

Using Timeline View
Once data is organized at the profile and group level, VALD Hub allows practitioners to move from viewing results to comparing sessions and identifying meaningful changes over time. Large volumes of testing data can often feel overwhelming; VALD Hub addresses this by enabling session comparisons and customizable dashboards, allowing practitioners to organize, interpret and apply data efficiently.
…VALD Hub [provides] session comparisons and customizable dashboards, allowing practitioners to organize, interpret and apply data efficiently.
The Timeline view (VALD Hub > Profiles > Timeline) enables practitioners to not only view single-session reports but also to track and compare longitudinal changes. Strength values, limb symmetry metrics and performance trends are displayed chronologically, helping practitioners identify key inflection points in rehabilitation and monitor trends that inform progression or regression decisions.
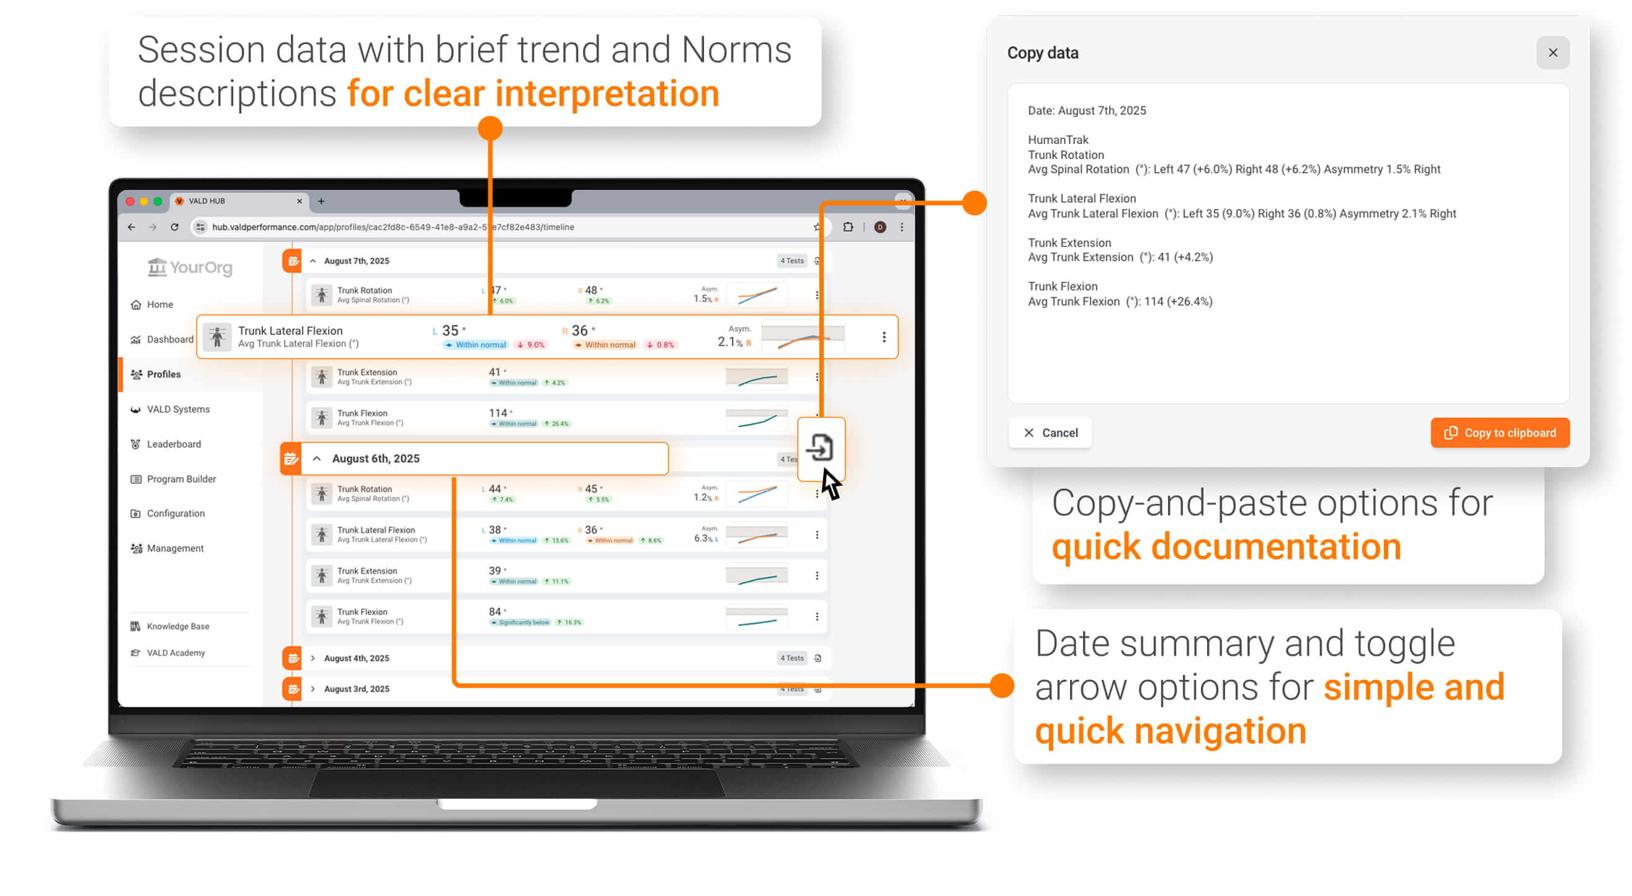
Timeline view also provides practitioners with a session-specific copy-and-paste function, allowing all objective assessments performed during a session to be quickly and accurately entered into any electronic medical record (EMR).
Using Group Dashboards
For practitioners interested in expanding their data management into in-depth group analysis, VALD Hub’s dashboards provide a simple, logical flow for gathering group trends and identifying key outliers.
Practitioners can create groups by assigning patients based on any number of factors, such as:
- Pathology (e.g., post-operative anterior cruciate ligament reconstruction)
- Sport (e.g., soccer)
- Position (e.g., defender, goalkeeper)
- Occupation (e.g., warehouse staff screening)
- Location or facility (e.g., CBD Clinic, West Beach Clinic)
…practitioners interested in expanding their data management…[can use] VALD Hub’s dashboards…[to gather] group trends and [identify] key outliers.
After creating a group, practitioners can use the Dashboard page to generate monitoring or quadrant charts that compare results across patients. By selecting the group, system, test and relevant metrics, practitioners can quickly identify trends, outliers and changes that inform decision-making.
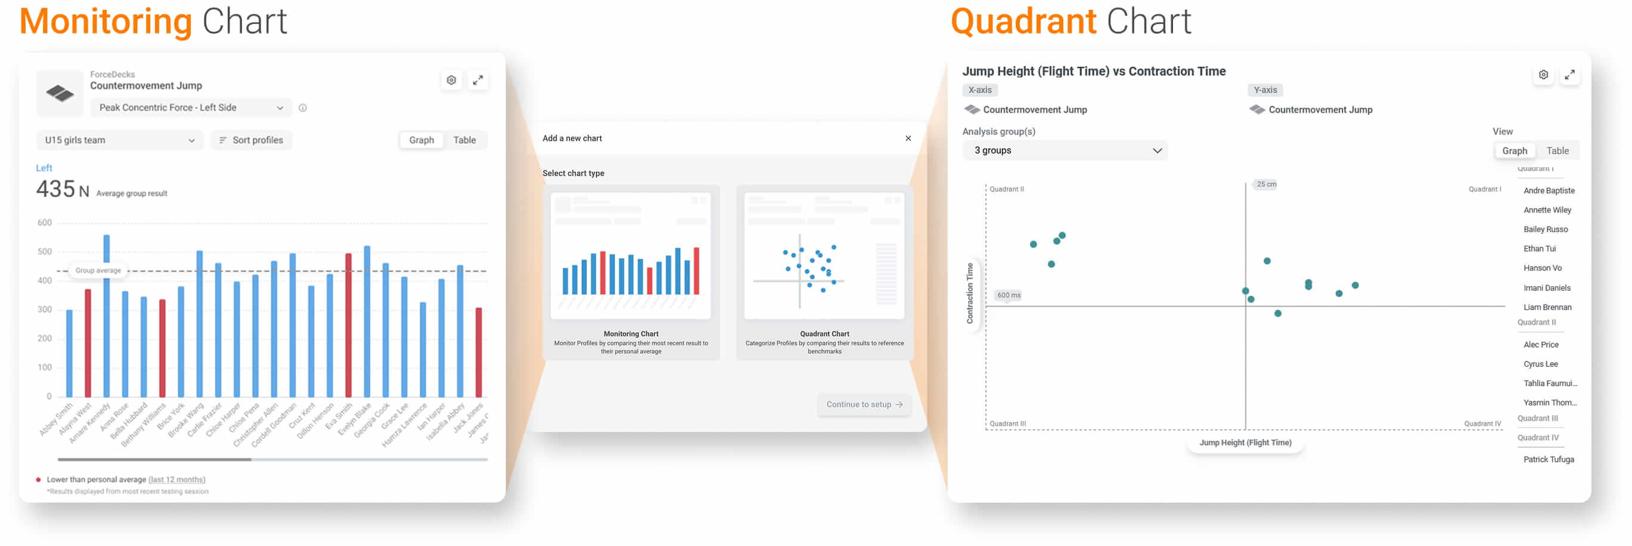
- Monitoring Charts: Often used to map high and low performers from key assessments across a group. They are particularly effective for practitioners who test consistently, as performance flags can be triggered based on percentage changes or z-score declines relative to prior assessments, catching outliers or performance deficits before they become significant setbacks.
- Quadrant Charts: Helpful to profile and inform specific performance comparisons that influence decision-making. For example, a practitioner may plot eccentric hamstring strength with isometric adductor strength, as introduced in the Quadrant of Boom Part 3, to inform potential hamstring injury risk in a group of field sport athletes.
Interpreting Results with Norms
For both novice and experienced practitioners, interpreting results becomes significantly more effective when each value is placed in context. VALD Norms are embedded throughout VALD Hub and rank results within age- and sex-specific percentiles, allowing practitioners to quickly determine whether a patient’s value is low, typical or high compared to their peers.
VALD Norms…rank results within age- and sex-specific percentiles, allowing practitioners to quickly determine whether a patient’s value is low, typical or high compared to their peers.
Within each profile, grey bars and percentile indicators appear alongside key metrics, enabling practitioners to gather clear insights from raw data and support more effective progression decisions and patient communication.
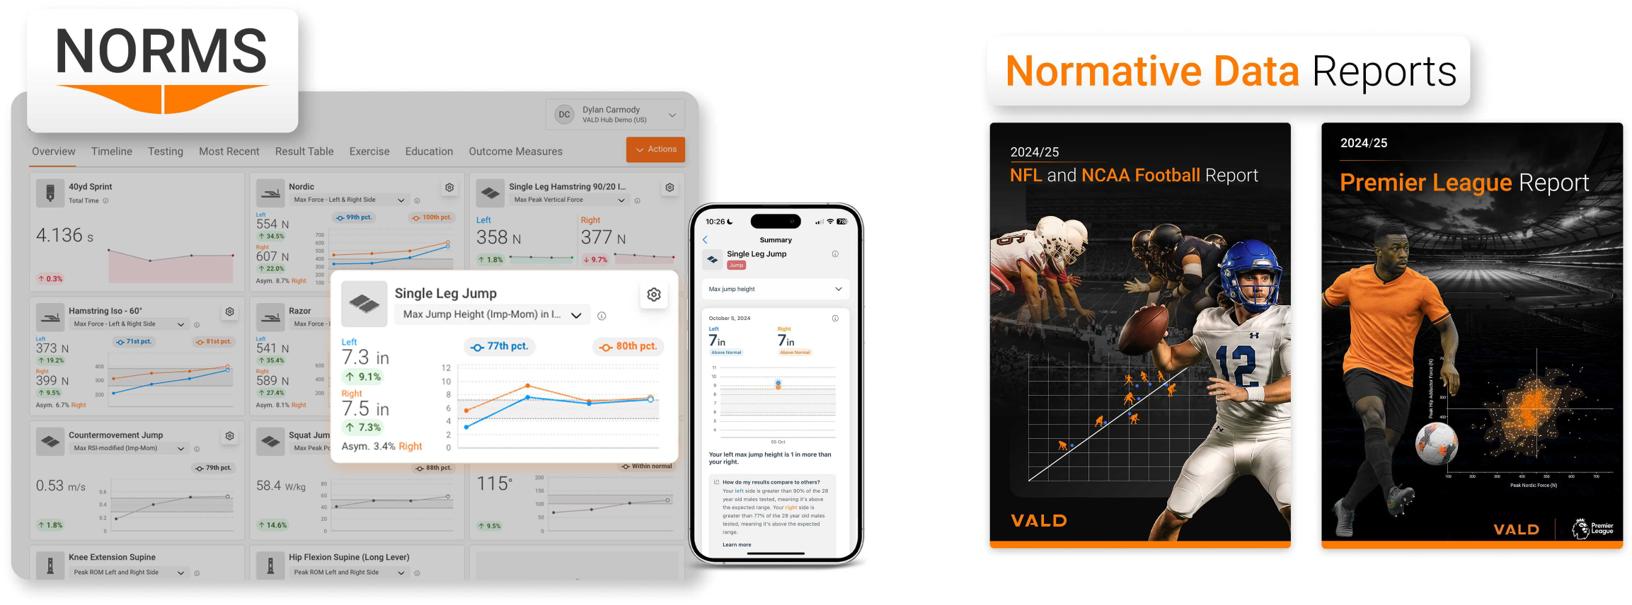
Beyond age- and sex-specific Norms, VALD Hub also offers over 80 different Normative Data Reports – such as the 2024/25 NFL and NCAA Football Report and 2024/25 Premier League Report – that summarize large-scale testing trends and highlight key tests and metrics associated with elite performance across sports.
Normative Data Reports and Research Normative Data Reports can be accessed and downloaded via (VALD Hub > Dashboard > Normative Data Reports).
Sharing Data Across Teams
Practitioners often need to communicate objective findings across multiple stakeholders, such as physicians, coaches and administrators.
On the Management page, account owners can add or remove users, assign access to specific groups and apply fine-grained permissions to control what each user can view or modify. This ensures each practitioner receives only the information relevant to their role while maintaining data security. Standardized PDF reports further support clear, consistent communication.
Multiple reporting and data sharing options are available within the VALD Hub ecosystem.
MoveHealth, VALD’s patient-facing mobile app, extends secure data sharing to patients by delivering assessment results, individualized exercise programs and patient education to their phone, providing access to their information wherever they go. Practitioners can invite patients directly from their profile using automated links.
MoveHealth…extends secure data sharing to patients…providing access to their information wherever they go.
Integrating VALD Hub into Daily Workflows
Practitioners who get the most out of VALD Hub do so through systematic workflows and intentional use of features that best support their practice. By standardizing testing protocols, utilizing the Timeline view consistently during reassessments and aligning Group Monitoring Dashboards with current care pathways, practitioners can streamline decision-making in busy environments.
When applied consistently, these workflows help practitioners reduce admin time, interpret results with greater clarity and communicate patient progress more effectively across stakeholders. Embedding these features into daily practice ensures objective data is used with purpose, supporting more efficient workflows and better-informed decisions.
…workflows help practitioners reduce admin time, interpret results with greater clarity and communicate patient progress more effectively…
Included with Every VALD System
All VALD system subscriptions include access to VALD Hub at no additional cost, with no licensing fees, optional upgrades or separate purchases required, as well as unlimited users, profiles and data storage. VALD Academy and MoveHealth are available to everyone, regardless of system subscription, completely free of charge.
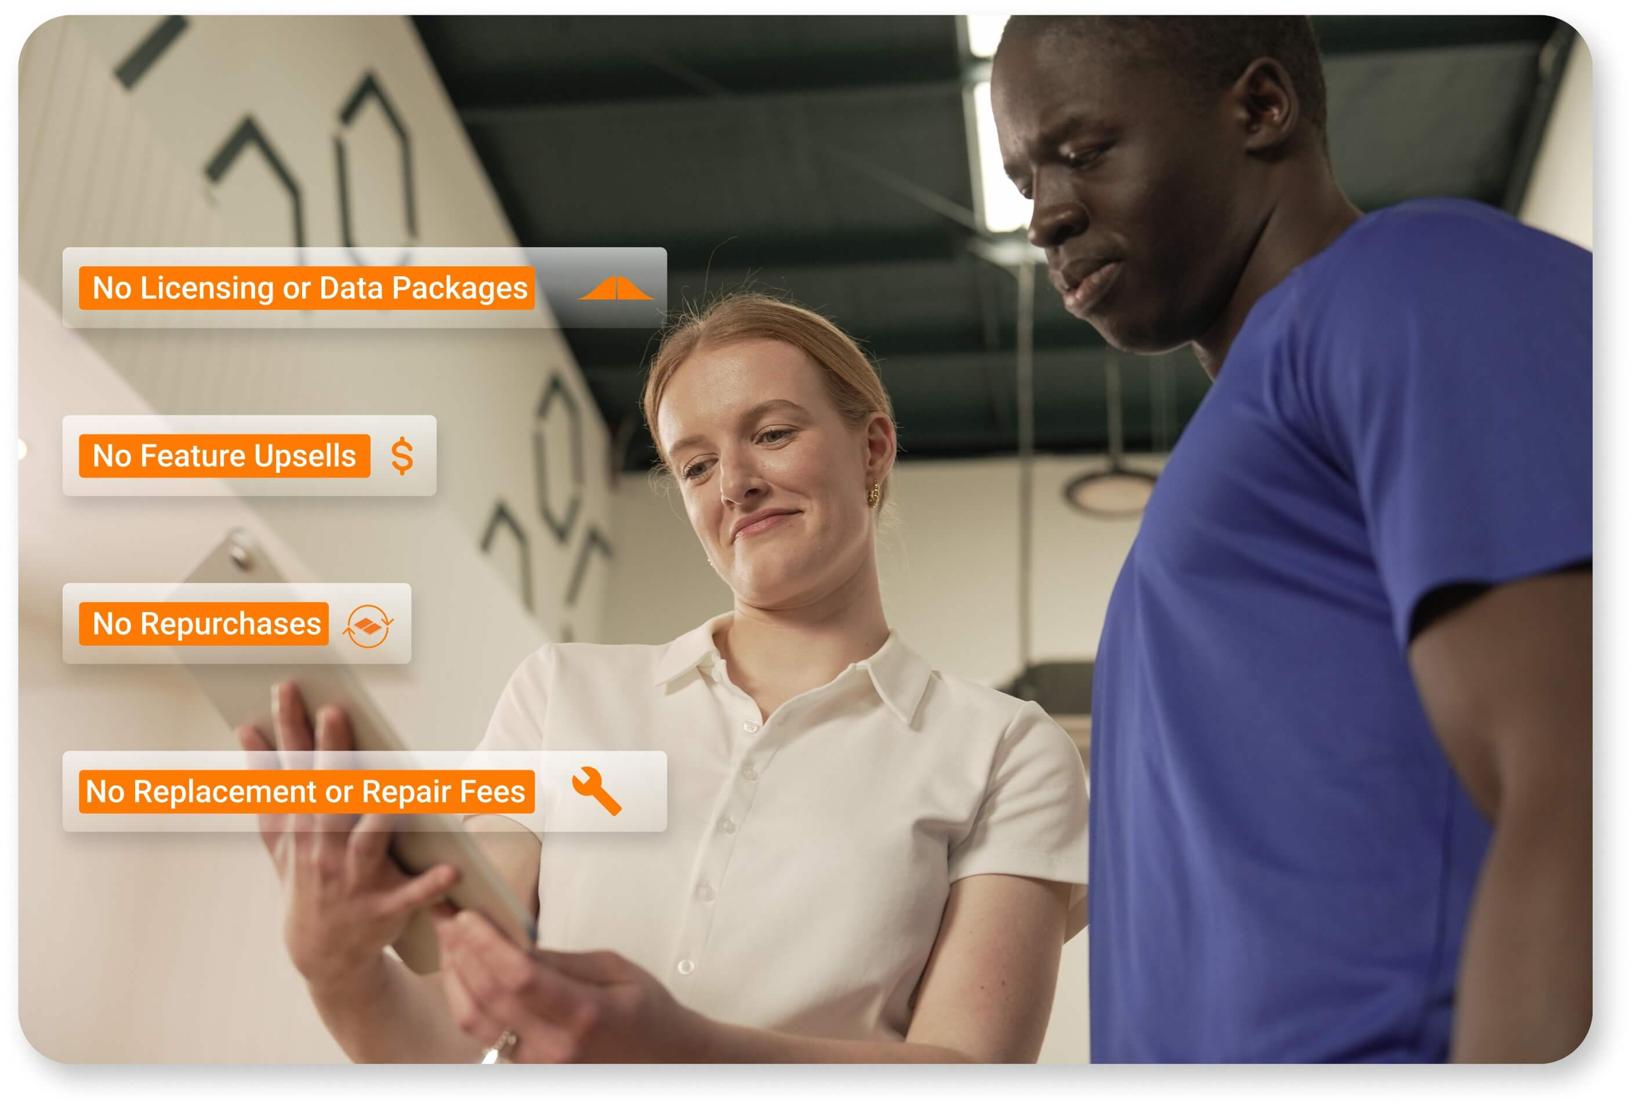
Ongoing software updates, new feature releases, technical support, warranty coverage and educational resources all form part of VALD’s all-inclusive pricing model.
This structure ensures practitioners are not simply purchasing hardware, but accessing an ecosystem supported by ongoing software development and expanding normative datasets. As new features are released and workflows improve, clients benefit automatically without hidden fees or upgrade costs.
When implemented consistently, VALD Hub enables practitioners to turn objective data into better-informed decisions, more efficient workflows and improved patient outcomes.
To learn how VALD Hub can be integrated into your practice or performance environment, connect with the VALD team to explore practical next steps.